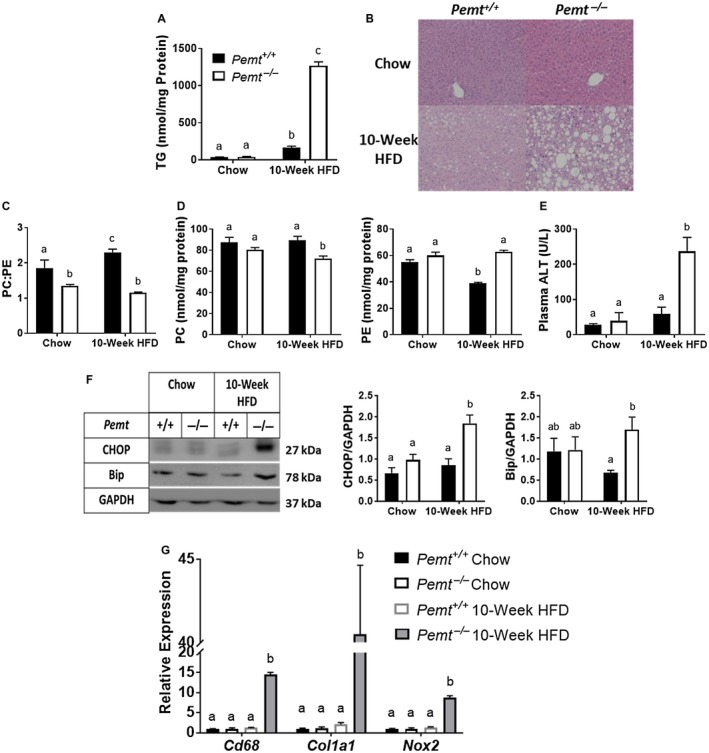
Figure 1.

Pemt–/– mice develop NASH when fed the HFD. Pemt+/+ and Pemt–/– mice were fed the chow diet or the HFD for 10 weeks. (A) Hepatic TG mass. (B) Representative hematoxylin and eosin staining of livers of Pemt+/+and Pemt–/– mice fed either the chow diet or the HFD for 10 weeks (magnification ×20). (C) PC:PE molar ratio. (D) Mass of PC and PE. (E) Plasma ALT levels. Values are means ± SEM (n = 6 per group). (F) Bip and ER stress‐responsive CHOP and densitometry. Values are means ± SEM (n = 4 per group). (G) mRNA expression of genes involved in inflammation (Cd68), fibrosis (Col1a1), and oxidative stress (Nox2). Values are means ± SEM (n = 5 per group) and are expressed relative to Pemt+/+ mice fed the chow diet; 2‐way ANOVA, followed by Fisher’s LSD post hoc test. Values that do not share a letter are significantly different (P < 0.05).
