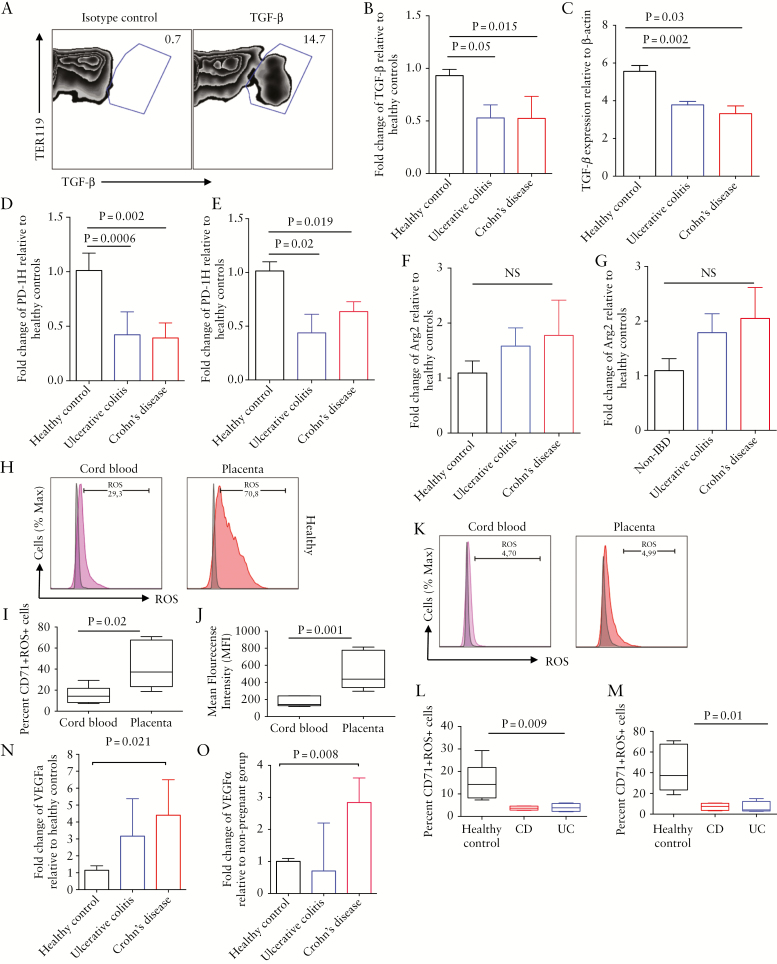
Figure 5.
Differential gene expression of inhibitory and stimulatory molecules by CD71+ erythroid cells of inflammatory bowel disease [IBD] patients versus healthy controls [HCs]. [A] Representative dot plots showing production of TGF-β by neonatal mice CD71+ erythroid cells. [B] Expression of TGF-β gene by CD71+ erythroid cells from cord blood or [C] placenta of HC compared with ulcerative colitis [UC] and Crohn’s disease [CD] patients. [D] Expression of PD-1H gene by CD71+ erythroid cells from cord blood or [E] placenta of HC compared with UC and CD patients. [F] Expression of arginase-2 gene by CD71+ erythroid cells from cord blood or [G] placenta of HC compared with UC and CD patients. [H] Representative plots showing expression of reactive oxygen species [ROS] among CD71+ erythroid cells from cord blood [pink] or placenta [orange] compared with isotype control [grey] of an HC. [I] Cumulative data showing percentages and [J] mean fluorescence intensity [MFI] of ROS+CD71+ erythroid cells in cord blood versus placenta of HCs. [K] Representative plots showing expression ROS among CD71+ erythroid cells from cord blood [pink] or placenta [orange] compared with isotype control [grey] of an IBD patient. [L] Cumulative data showing percentages of ROS+CD71+ erythroid cells in cord blood and [M] placenta of IBD versus HCs. [N] Expression of VEGF-α gene by CD71+ erythroid cells from cord blood or [O] placenta of HC compared with UC and CD patients. Data are obtained from a minimum of 5–7 patients/group.

