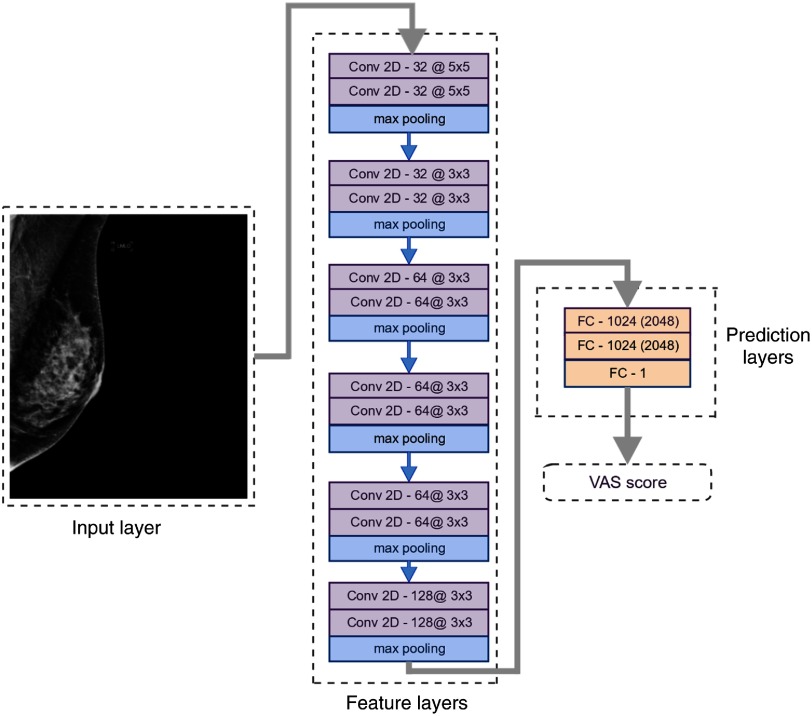
Fig. 2.
Network architecture and characteristics of each layer. The number of feature maps and the kernel size of each convolutional layer are shown as: feature maps@kernel size. The fully connected layers are marked with FC followed by the number of neurons in the layer for the low-resolution input and the number of neurons for the high-resolution input in parenthesis.

