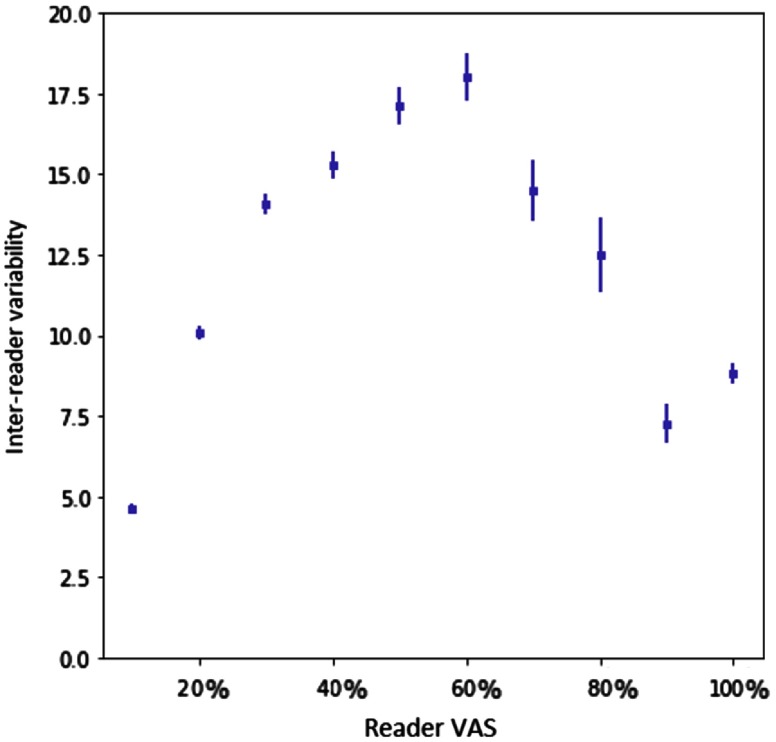
Fig. 5.
Plot of inter-reader variability with 95% CI for ranges of 10 values of reader VAS score. -axis shows the ranges of reader VAS (average of two readers) and -axis shows the average inter-reader variability. Inter-reader variability is computed as the absolute difference between the scores of two readers for each mammographic image.

