Figure 5.

Venn diagram representing Common Core Biome of fungal communities characteristic of different soil pH groups. Fungal 20 representatives were selected, assuming minimum abundance equal to 1% and the presence in all soils of a pH group.

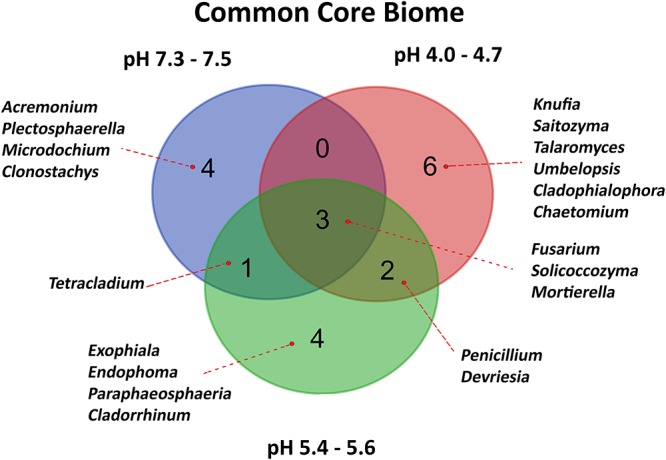
Venn diagram representing Common Core Biome of fungal communities characteristic of different soil pH groups. Fungal 20 representatives were selected, assuming minimum abundance equal to 1% and the presence in all soils of a pH group.