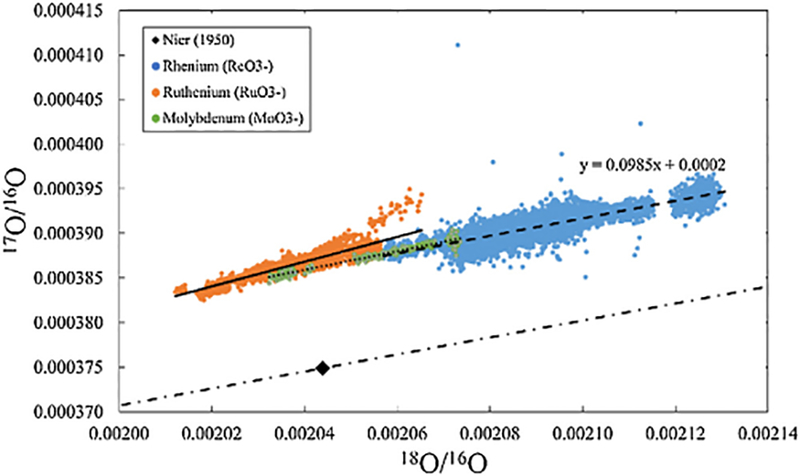
Fig. 1.

Measured oxygen isotopic compositions for ReO3− (this study), RuO3− [20], and MoO3− [21]. The oxygen isotopic composition of atmosphere reported by Nier (1950) and a terrestrial fractionation line (dashed-dotted line), which were used by previous studies [14,1] are shown for reference. Linear regressions are shown as dashed (ReO3−), solid (RuO3−), and dotted (MoO3−) lines.
