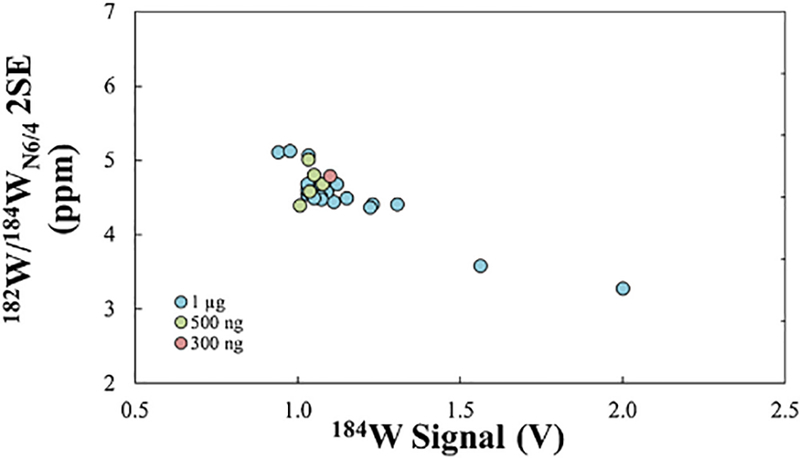
Fig. 5.

Average 184W signal (volts) during analyses vs. the internal precision (2SE) for 182W/184W (normalized to 186W/184W) of 26 analyses of 300ng–1000 ng Alfa Aesar W standards that were measured for 600 integrations. Analyses of both thick and thin filaments are included. Analyses that were measured for fewer than 600 integrations are not included.
