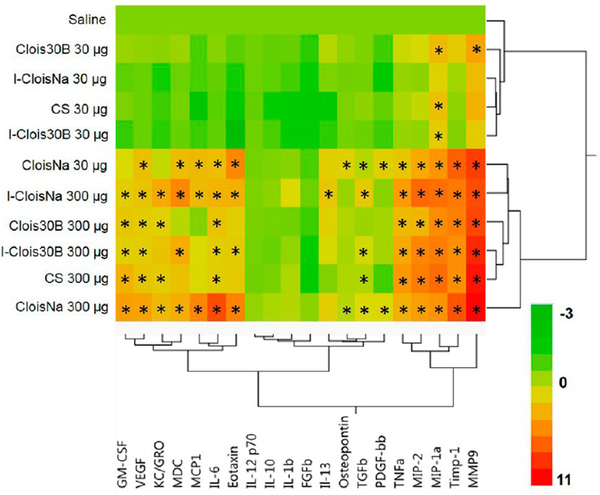
Figure 5.
Heat map and hierarchical cluster analysis of BAL cytokine expression profiles at day 1 following pre- and post-incinerated organomodified nanoclay pulmonary exposure. Color scale bar represents Log2-fold change values. * indicate those treatments that were significantly different from their time-associated vehicle controls (p < 0.05, n = 8).

