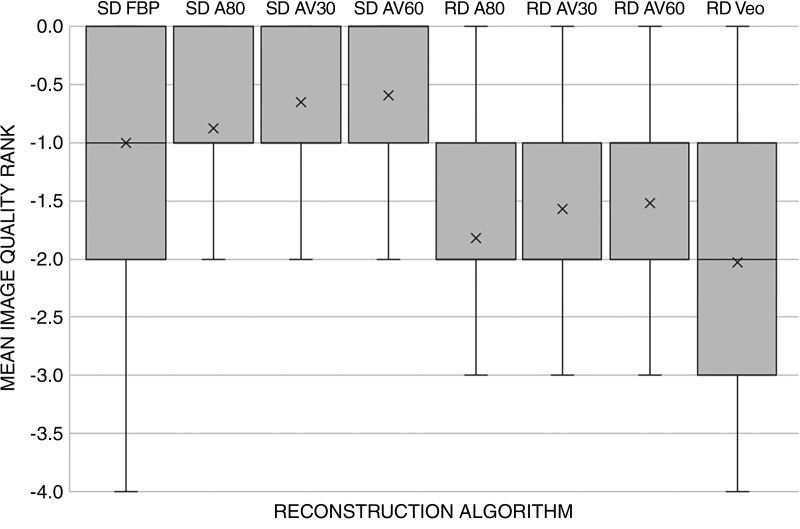
Figure 2:
Graph shows results of qualitative image evaluation of overall image quality rank. A score of 0 was given for the best series, −1 for slightly inferior (no influence on diagnosis), −2 for mildly inferior (possible influence on diagnosis), −3 for moderately inferior (probable influence on diagnosis), and −4 for markedly inferior (impairing diagnosis). Mean image quality rank was significantly different from the next best reconstruction except between the standard dose (SD) and reduced dose (RD) adaptive statistical iterative reconstruction AV60/AV30 reconstructions (P = .89) and the SD filtered back projection (FBP)/SD A80 reconstructions (P = .57). A80 = adaptive statistical iterative reconstruction (ASIR) 80%, AV30/60 = ASIR-V 30%/60%.

