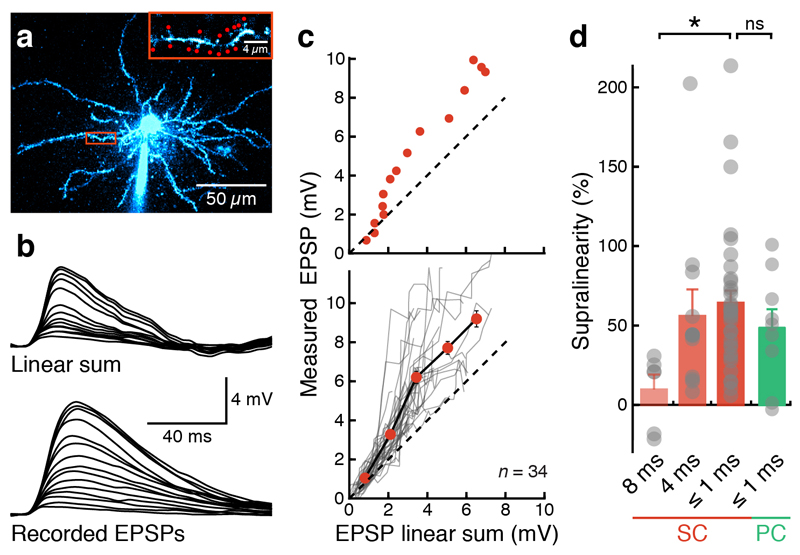
Figure 1. Supralinear synaptic integration in MEC principal neurons.
(a) Two-photon image of a MECII stellate cell filled with Alexa Fluor 594 via somatic patch-clamp recording. Inset shows the selected dendrite and the uncaging locations (red spots). (b) Somatic voltage responses to increasing number of stimulated synapses (indicated in the inset in a). Top traces show arithmetic sums expected from the individual responses; bottom traces show recorded responses (15 spines, 0.6-ms stimulation interval). (c) The amplitudes of somatically recorded glutamate uncaging-evoked EPSPs (gluEPSPs) were markedly larger than the arithmetic sum of the individual responses (dashed line indicates unity). Top, single experiment (as in a and b); bottom, summary of 34 experiments. Grey lines represent individual experiments; the black line connects binned averages across experiments (red). Error bars represent s.e.m.. (d) Nonlinearity depends on the interval between uncaging events (*P < 0.05). No significant difference in the degree of supralinearity was found between stellate cells (SC) and pyramidal cells (PC) of MECII (at ≤1-ms stimulation intervals). Nonlinearity in stellate cells at different stimulation intervals: 8 ms, 9 ± 9% (n = 6); 4 ms, 54 ± 16% (n = 11); ≤1 ms, 65 ± 7% (n = 34); one-way ANOVA for different stimulation intervals, P = 0.02, F = 4.22; nonlinearity in pyramidal cells at stimulation intervals; ≤1 ms: 48 ± 11% (n = 9; Mann-Whitney U test, P = 0.18 compared to stellate cells).

