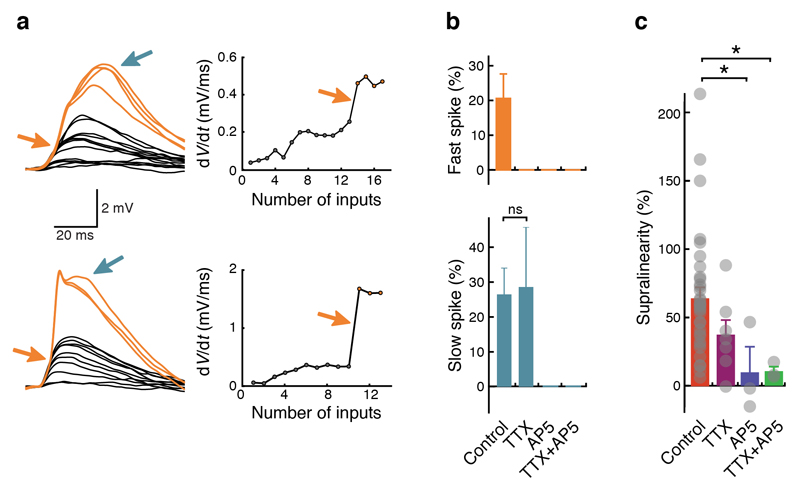
Figure 2. Supralinear integration and dendritic spikes depend on voltage-gated sodium (Nav) and NMDA receptor channels.
(a) Left: examples of fast (orange arrows) and slow (blue arrows) dendritic spikes. Right: plots of dV/dt against number of uncaging locations. Fast dendritic spikes cause a step-like increase in dV/dt (arrows). (b) Top: fast dendritic spikes are present in 21 ± 7% (n = 34) of all recordings and abolished when Nav channels are blocked with tetrodotoxin (TTX) and/or when NMDARs are blocked with APV ((2R)-amino-5-phosphonovaleric acid). Bottom: slow dendritic spikes are present in 26 ± 7% (n = 34) of all recordings, still present in TTX (29 ± 17%; n = 7; Fisher’s exact test, P = 1.0) and abolished when NMDARs are blocked with APV. Uncaging interval ≤ 1 ms. Individual data points (not indicated in the figure) are either zeroes (no spikes were observed in a recording) or ones (spikes were observed in a recording). Bar graphs indicate the percentage of recordings containing spikes; error bars were calculated by Monte Carlo methods. (c) Application of TTX and APV reduces or abolishes supralinear dendritic integration. Grey dots represent individual recordings. Control: 65 ± 7% (n = 34); TTX: 36 ± 11% (n = 7; Mann-Whitney U test, P = 0.07 compared to control); APV: 11 ± 21% (n = 3; Mann-Whitney U test, P = 0.02 compared to control). TTX+APV: 11 ± 5% (n = 3; Mann-Whitney U test, P = 0.02 compared to control). One-way ANOVA, P = 0.03, F = 3.16.

