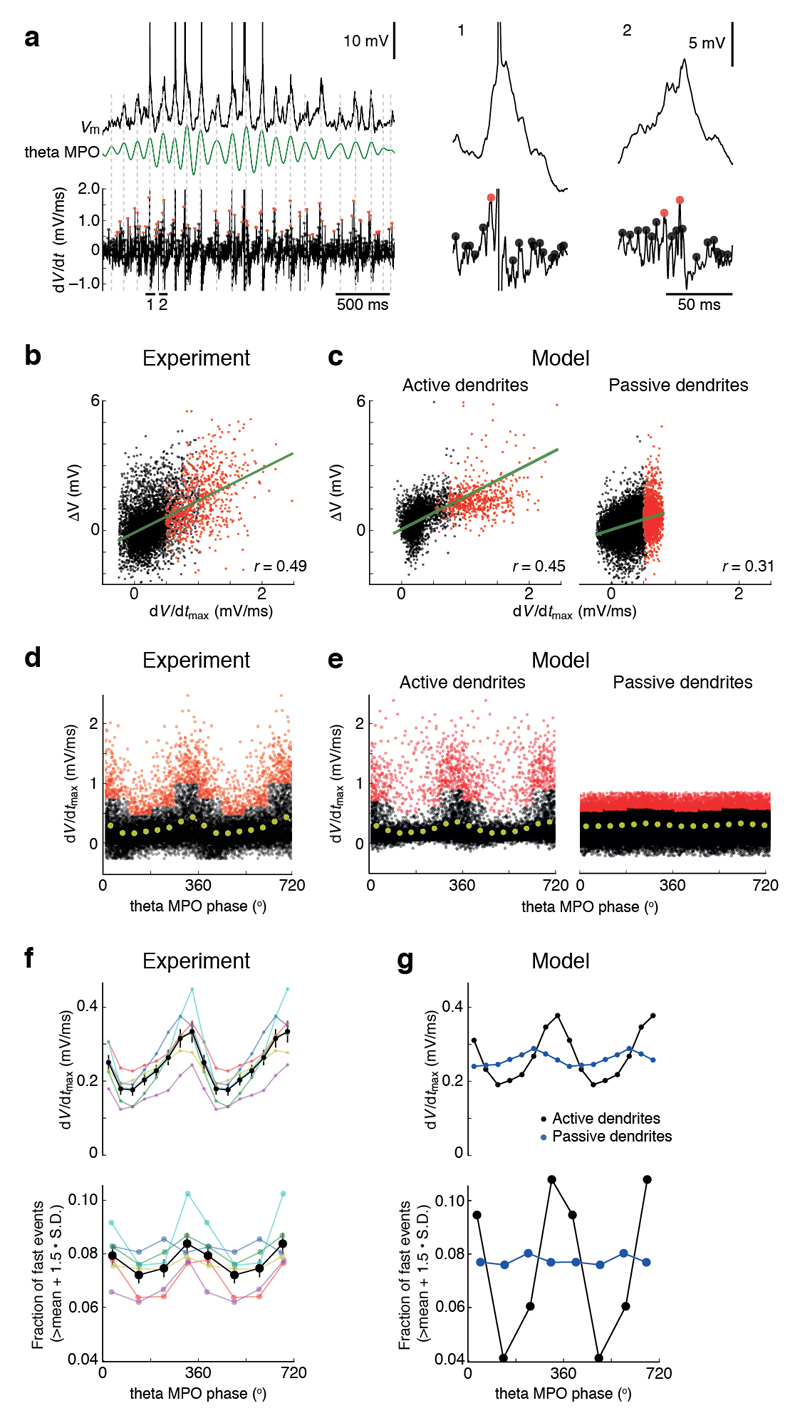
Figure 3. Engagement of active dendritic conductances in MECII principal neurons in vivo.
(a) Left: membrane potential (Vm; top), theta membrane potential oscillations (theta MPOs; middle, green trace) and differentiated membrane potential (dV/dt; bottom) during a firing field crossing in a MECII neuron (experimental data from Schmidt-Hieber and Häusser18). Grey dashed vertical lines indicate peaks (0° phase) of theta MPOs. Right: membrane potentials and differentiated membrane potentials at higher magnification for two episodes corresponding to the horizontal bars at the bottom of the traces on the left. Filled circles on dV/dt traces indicate peaks in dV/dt that are below (black) or above (red) the mean + 1.5 s.d. of all peaks within 90° bins of theta MPO phases. (b) Plot of peaks in membrane potential against corresponding peaks in dV/dt for the recording shown in a. Colors as in a. Green line represents a linear regression (r = 0.49; P < 10−5; n = 8,265 peaks). (c) As in b, for a detailed compartmental model of a MECII stellate cell with active (left; r = 0.45; P < 10−5; n = 14,411 peaks) or passive dendrites (right; r = 0.31; P < 10−5; n = 25,228 peaks). See Online Methods for model details. (d) Plot of peaks in dV/dt against the phase of theta MPOs for the recording shown in a. Colors as in a. Yellow filled circles represent binned averages. (e) As in d, for compartmental model data with active (left) or passive dendrites (right) as in c. (f) Analysis of n = 6 stellate cell recordings (data from Schmidt-Hieber & Häusser18). Peaks in dV/dt (top) and fraction of dV/dt peaks exceeding mean + 1.5 s.d. of all peaks within 90° bins of theta MPOs (bottom) are plotted against theta MPO phase. Black lines and symbols, average data. Error bars represent s.e.m. Colored lines and symbols show individual recordings. (g) As in f, for compartmental model data with active (black) or with passive dendrites (blue).

