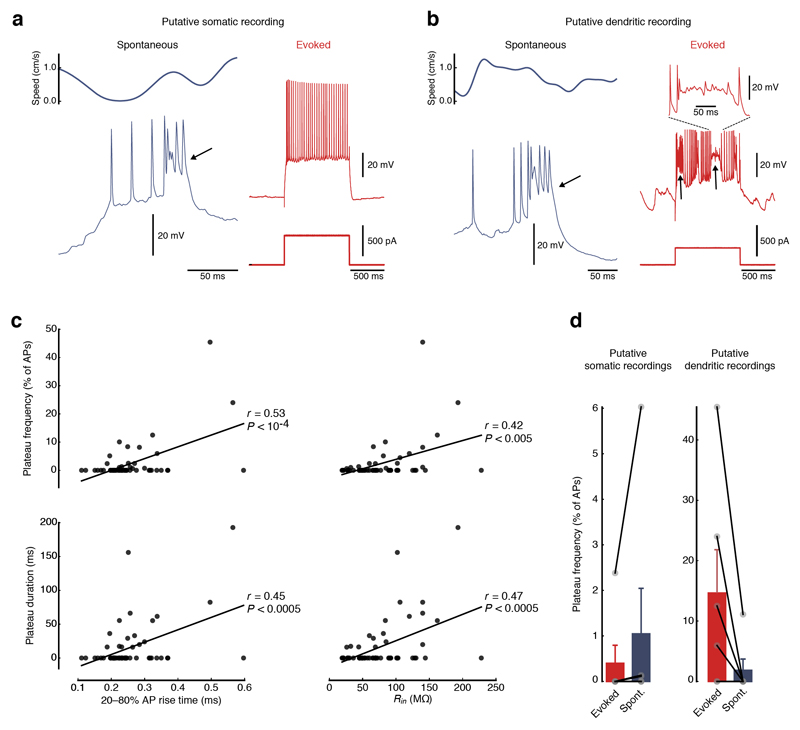
Figure 4. Plateau potentials suggest that active dendritic conductances are engaged in vivo.
(a) Example of a putative somatic recording from a MEC neuron in vivo. Plateau potentials (arrows) occur spontaneously (left, top trace shows animals speed, bottom trace shows membrane potential) but not during current injections (right, top traces show membrane potential, bottom traces show current injections). (b) Example of a putative dendritic recording from a MEC neuron in vivo. Plateau potentials (arrows) occur both spontaneously (left, top trace shows animals speed, bottom trace shows membrane potential) and upon current injections (right, top traces show membrane potential, bottom traces show current injections). Inset (top right) shows an enlarged view of an evoked plateau potential. (c) Frequency and duration of plateau potentials correlate with parameters that are characteristic of dendritic recordings. Plateau frequencies per action potential (top) and plateau durations (bottom) are significantly correlated with rise times of action potentials (left) and input resistance (right). Black lines represent linear regressions (n = 58 recordings). (d) Summary bar graphs of evoked and spontaneous plateau frequencies per action potential in (left) putative somatic (evoked, 0.4 ± 0.4%; spontaneous, 1.0 ± 1.0%, n = 6) and (right) dendritic recordings (evoked, 14.7 ± 7.2%; spontaneous, 1.9 ± 1.9%, n = 6). Filled gray circles represent individual recordings. Error bars represent s.e.m.

