Figure 1.

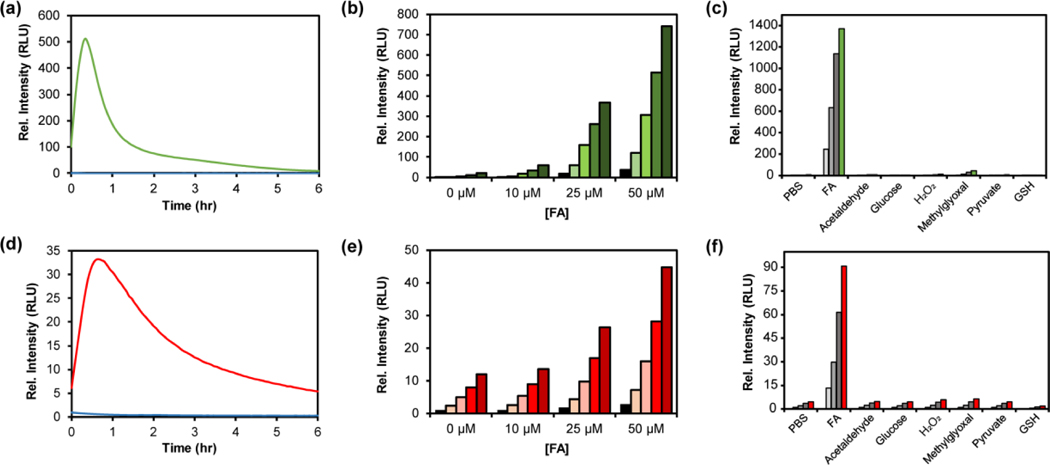
(a,d) Chemiluminescence kinetic profiles of 10 μM (a) CFAP540 or (d) CFAP700 to 0 μM FA (blue trace) and 10 mM FA (green or red trace) in PBS (10 mM, pH 7.4, 10% FBS) at 37°C. (b,d) Chemiluminescence responses of 10 μM (b) CFAP540 or (e) CFAP700 to 0, 10, 25 and 50 μM FA. Data were acquired in DMEM growing media at 37 °C. Bars represent time points taken at 0 (black), 30, 60, 120 and 240 min (green or red) after addition of FA. (c,f) Chemiluminescence responses of 10 μM (c) CFAP540 or (f) CFAP700 to RCS or relevant biological analyte. Bars represent emission intensity responses to 100 μM analyte for 0 (lightest gray), 30 (light gray), 60 (gray), 90 (dark gray), and 120 (colored) min.
