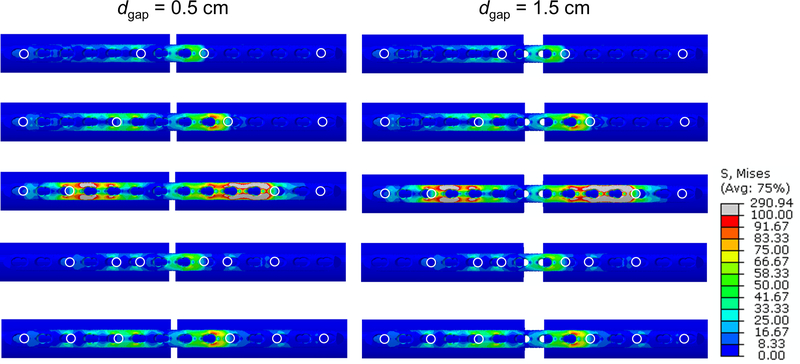
FIGURE 2.
Examples of FEA results for fracture fixation with 26 cm plate and axial loading. Left and right columns show 0.5 and 1.5 cm fracture gap, respectively, and each row shows a different screw configuration. Von Mises stresses are displayed for the plate. White circles indicate screw locations.

