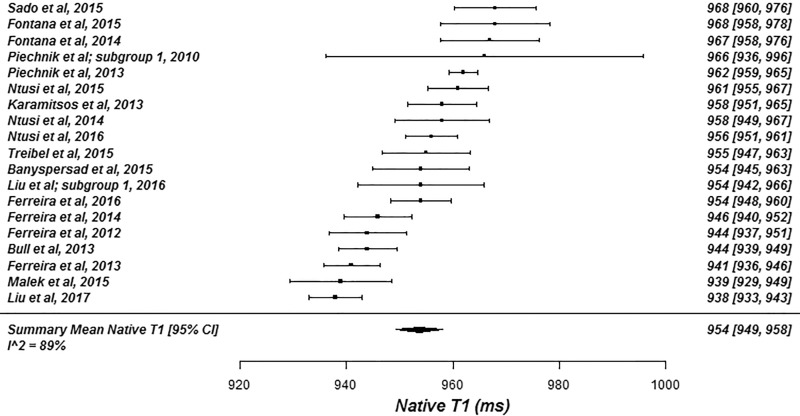
Figure 2c:
Forest plots of native T1 studies at 1.5-T cardiac MRI in healthy participants. Studies are grouped by vendor and pulse sequence scheme. (a) Native T1 studies from Philips modified Look-Locker inversion recovery (MOLLI) subgroup, (b) native T1 studies from Siemens MOLLI subgroup, and (c) native T1 studies from Siemens MOLLI subgroup. Studies with multiple subgroups are noted by author last name and year of publication..

