
Table 2:
Analyses According to Subgroup
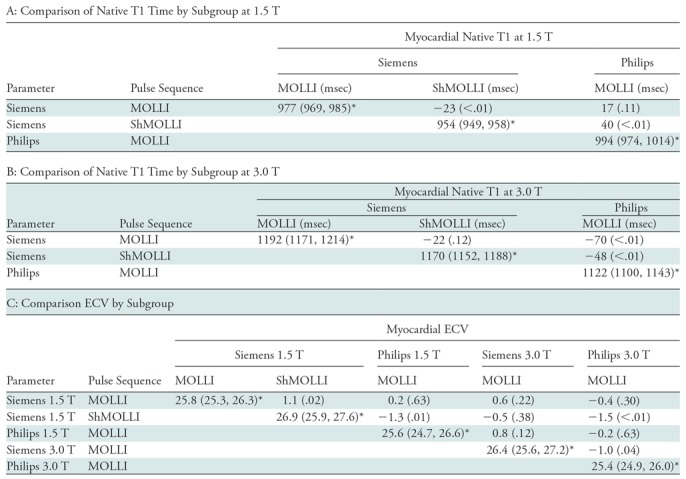
Note.—Unless otherwise indicated, data are the difference between the subgroup in the row and the subgroup in the column; the associated P value is in parentheses. ECV = extracellular volume, MOLLI = modified Look-Locker inversion recovery, ShMOLLI = shortened modified Look-Locker inversion recovery.
*Data are pooled mean of each subgroup; data in parentheses are 95% confidence intervals.