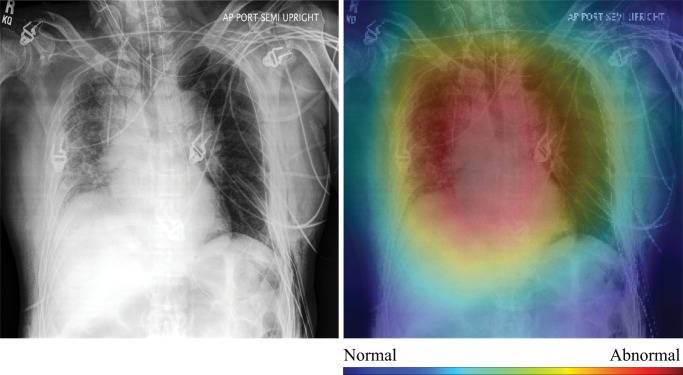
Figure 4a:
High-resolution histogram-equalized images (left) and normalized class activation maps (CAMs) (224 × 224 resolution) (right) show (a) true-positive (decreased right lung volume; convolutional neural network [CNN] score 0.99), (b) false-positive (necklace; CNN score 0.57), (c) false-negative (borderline cardiomegaly; CNN score 0.48), and (d) true-negative (humerus fracture; CNN score 0.41) findings of thoracic disease. Red indicates areas of relatively high contribution to an abnormal score, while blue areas indicate the opposite. Because color information is normalized within each image, comparison of values across CAMs is not appropriate.

