
Table 2:
Performance Metrics for Different Model Classes
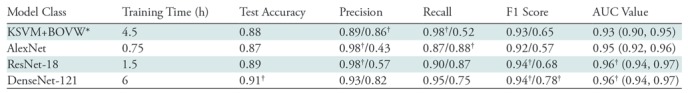
Note.—Comparison of performance metrics for different model classes with a training size of 180 000 samples, a development size of 2000 samples, and pretrained initialization for convolutional neural networks (CNNs). All metrics represent average values over five trials with different random seeds, and CNN metrics are computed by using an untuned threshold value of 0.5. Data to the left of the virgule are for the abnormal class, and data to the right are for the normal class. Key descriptive statistics are total samples (n = 533), true abnormal (positive) findings (n = 423), and true normal (negative) findings (n = 110). DenseNet-121 area under the receiver operating characteristic curve (AUC) is not significantly different from that for ResNet-18 (P > .05); however, it is significantly different from that for AlexNet and kernelized support vector machine with bag-of-visual-words (KSVM+BOVW) features (P < .05). Data in parentheses are 95% confidence intervals.
*KSVM+BOVW model was trained on four CPUs, while other models were trained on a Tesla P100 GPU [graphics processing unit].
†Data are best observed values.