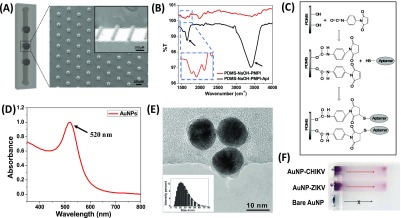
Figure 2.
Schematic representation of the microfluidic channel and detailed characterization of different components of the present sensor. (A) Image of a single microfluidic channel. The SEM image representing a magnified view of the testing zone showing the presence of pillars with an average diameter of 50 μm. (B) FTIR spectroscopy of the microfluidic channel after PMPI and aptamer treatments. Peaks at 1698 and 1531 cm–1 represent amide I and amide II bands in PMPI, which indicate the presence of urethane linkages. (C) Schematic representation of the reaction for functionalization of the channel using PMPI as the linker molecule. (D,E) UV–visible spectroscopy and TEM analysis of the Turkevich method-based AuNPs. Inset shows narrow size distribution of the particles in the range of 15–20 nm as measured by dynamic light-scattering measurement. (F) Gel electrophoresis of bare and aptamer-conjugated AuNPs. Migration is observed in the aptamer-conjugated samples because of the negative charge on the particle surface.

