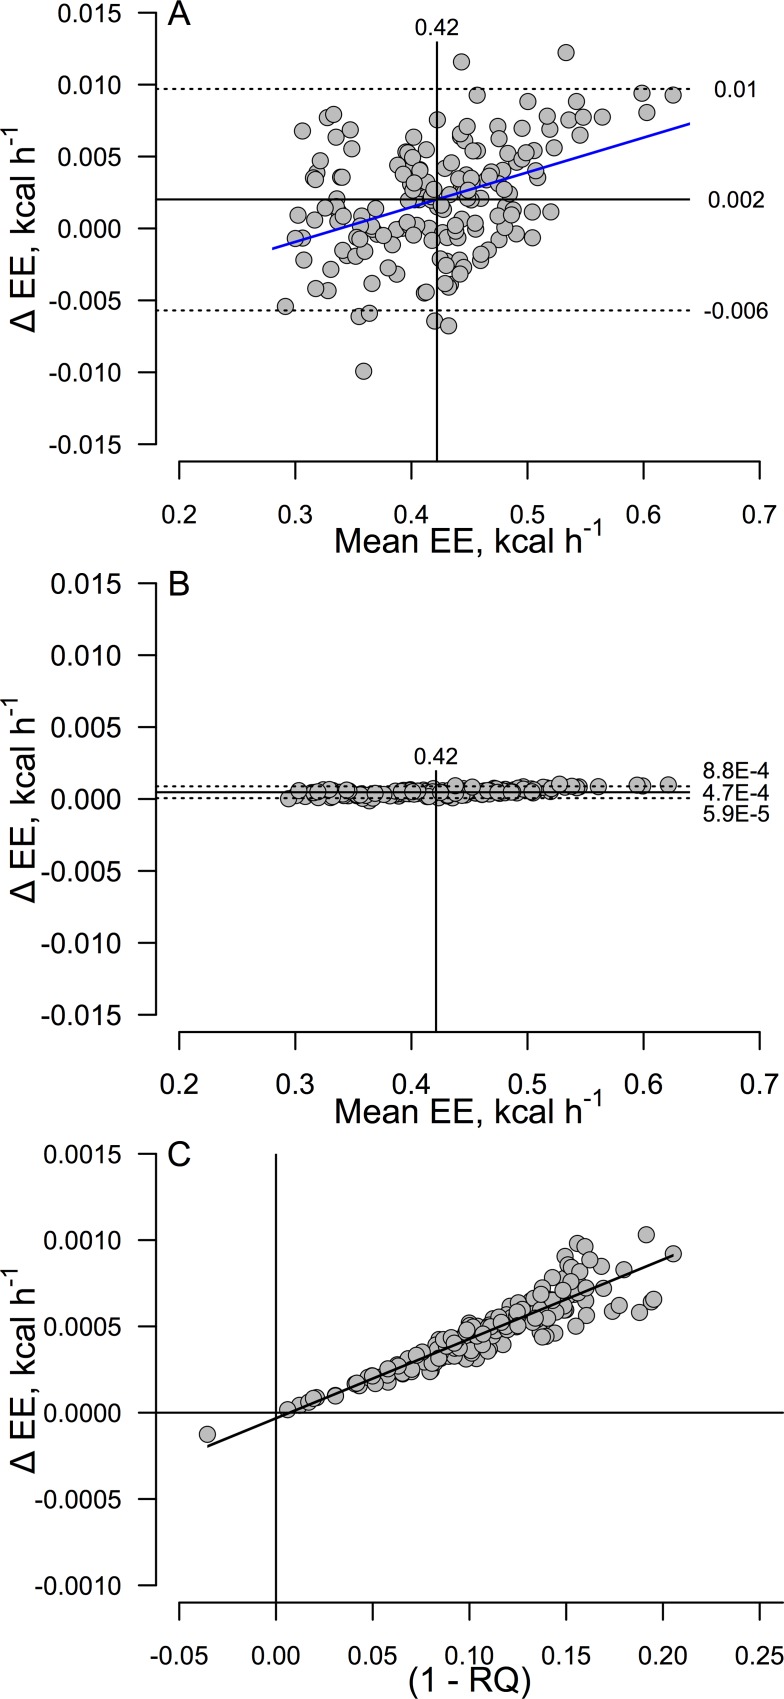
Fig 2. Tukey-Bland-Altman mean-difference agreement plots comparing EE computed by alternative methods, and error as a function of RQ.
In panels A and B the x-axis depicts the mean of two methods being compared and the y-axis depicts the difference; the standard Weir RQ+ method was subtracted from the other method (refer to text or Fig 1 for equations). The plots indicate the mean bias (solid horizontal lines) ± 2 SDs (dashed lines) and mean EE (solid vertical lines). (A) Agreement between the Weir EE equation using FQ as a proxy for RQ and the standard Weir RQ+ EE. (B) Agreement between the Weir RQ- equation and the standard Weir RQ+ equation. The superiority of this method over the one assuming that RQ equals FQ is striking. (C) Weir RQ- minus Weir RQ+ EE differences as a function of 1 minus RQ. Note that the predicted mean EE difference between methods at RQ = 0.7 is just 0.0014 kcal/h, which represents 0.31% of the corresponding metabolic rate calculated from the RQ+ method at RQ = 0.7. Data consist of 168 measurements of 24h EE in n = 8 mice. EE, energy expenditure; RQ, Respiratory Quotient; FQ, Food Quotient; ΔEE = Weir FQ+ or Weir RQ- minus standard the Weir RQ+ EE difference.

