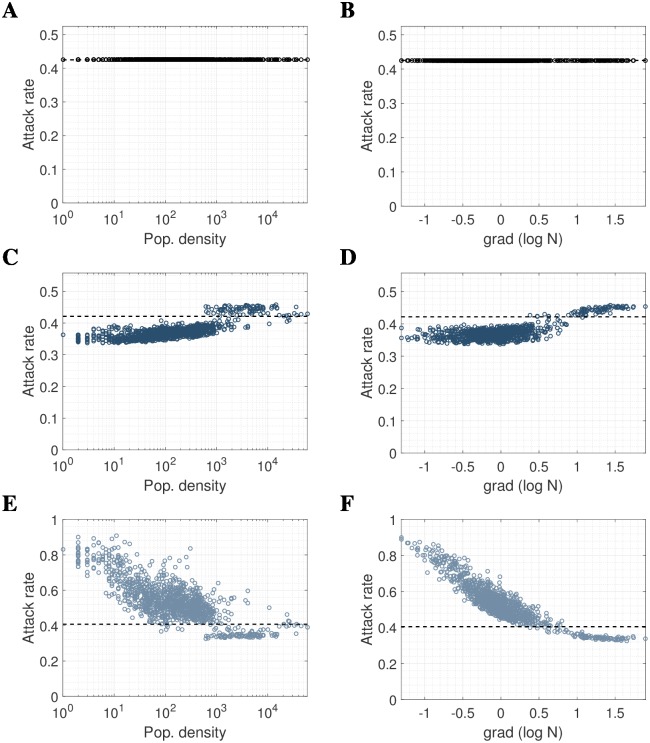
Fig 1. The relationship between force-of-infection (FOI) assumptions, local attack rates, population density and population density gradient, for a pandemic-influenza-like epidemic.
The LHS shows the relationship between population density N (people/km2) and attack rate for (A) mobility independent of infection status (dual mobility), (C) mobility in non-infectious population only (S-mobility) and (E) mobility in infectious population only (I-mobility). The RHS shows the relationship between the gradient of log10N and attack rate for (B) dual mobility, (D) S-mobility and (F) I-mobility. We used a 33km by 55km grid of 1km by 1km pixels to the North-East of Guangzhou, with kernel parameters α = 0.52, a = 0.58, p = 2.72 and influenza natural history parameters R0 = 1.8, γ = 1/2.6. Population gradient was defined as the difference between the log population density of a pixel and the average log population density of the 8 surrounding pixels.

