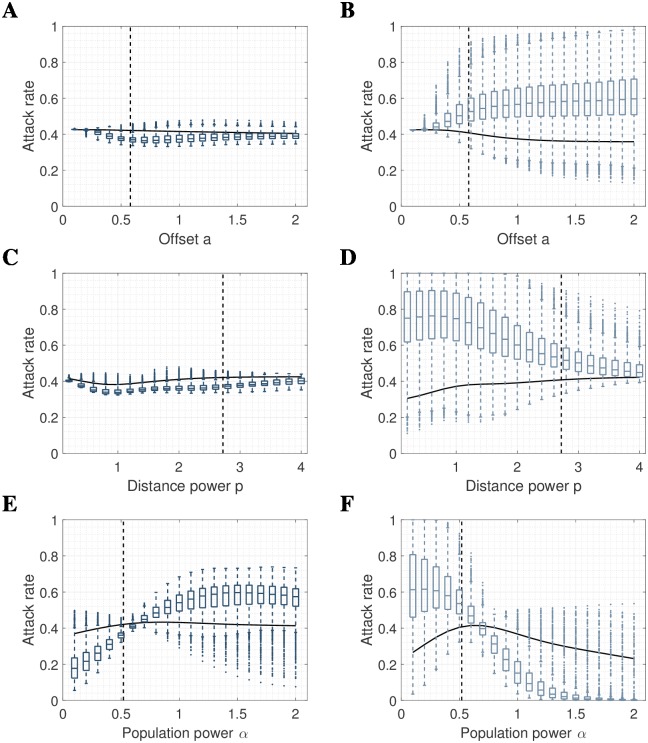
Fig 5. Sensitivity analysis.
Distribution of local attack rates with respect to (A) offset a using S-mobility. (B) offset a using I-mobility, (C) distance power p using S-mobility, (D) distance power p using I-mobility, (E) population power α using S-mobility, and (F) population power α using I-mobility. Box plots show standard percentiles and outliers, solid lines show global attack rate, and dashed lines show parameter values used in the main result. When fixed, all parameters are as in main result, i.e. a = 0.58, p = 2.72, α = 0.52. Dual mobility are omitted as they are flat with variance σ2 = 0. Empty pixels yield attack rate zero and are omitted from calculations.

