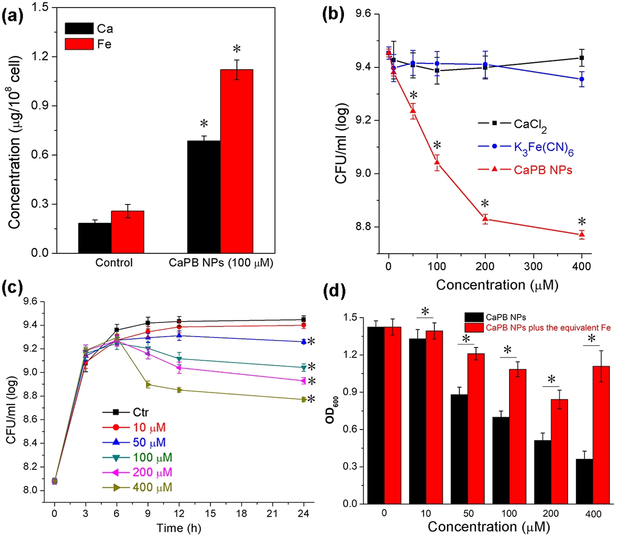
Figure 4.
Effect of CaPB NPs on S. aureus cells. a) Results of metal concentration analysis from the S. aureus cellular lysates after 24 hours of incubation. *Mean value significantly different from that for the control group. P < 0.05, n = 3. b) Inhibiting curves of S. aureus cells incubated with various amounts of CaPB NPs (red), CaCl2 (black) and K3[Fe(CN)6] (blue). Experiments were performed in TSB medium at 37 °C for 24 hours. *Mean value significantly different from that for the untreated CaPB NPs groups. P < 0.05, n = 3. c) Results of time-dependent CaPB NPs growth inhibition of S. aureus with different concentrations of CaPB NPs. Experiments were performed in TSB medium at 37 °C. *Mean value significantly different from that for the control group. P < 0.05, n = 3. d) OD600 values of S. aureus cells incubated with CaPB NPs alone (black) and with CaPB NPs followed by addition of an equivalent amount of Fe to the cell culture after 2 hours incubation (red). *Mean value significantly different from that for the iron added groups. P < 0.05, n = 3.

