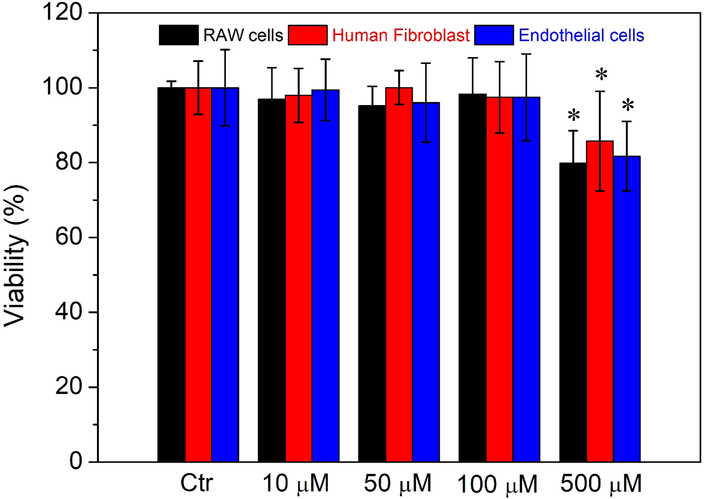
Figure 6.
Results of cell viability studies in murine RAW 264.7 cells (black), human fibroblast cells (red), and endothelial cells (blue) incubated with different concentrations of CaPB NPs. Experiments were performed using MTT assay and incubated for 24 hours. *Mean value significantly different from that for the untreated CaPB NPs groups. P < 0.05, n = 3.

