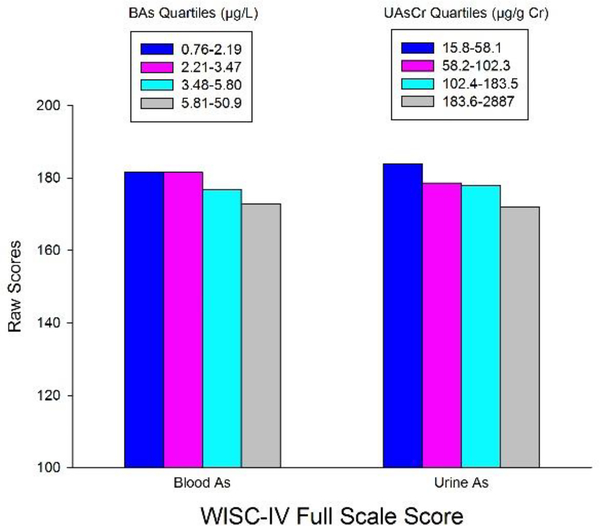
Figure 1.
The relationships between quartiles of WAs and UAs and adjusted WISC-IV full scale raw scores. Scores were adjusted for child’s years 8.2 (−14.5, of education, head circumference, maternal intelligence, paternal education and home construction wall type. The mean difference in Full Scale scores between the highest and lowest quartiles of BAs was −8.2 (−14.5, −1.8); for WM the corresponding difference was smaller but still significant [ −1.5 (−2.7, −0.4)].

