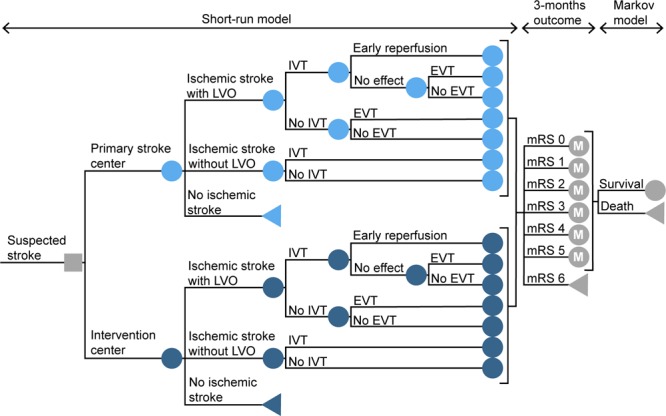
Figure 1.

Schematic overview of the model structure. The model starts with the initial decision of transportation to the primary stroke center or to the nearest endovascular-capable intervention center. The short-run model calculates the probability of every possible pathway and the associated distribution of the modified Rankin Scale (mRS) score after 3 mo. It takes into account driving times, in-hospital workflow characteristics, and time-dependent treatment effects. In each annual cycle of the following Markov model, patients can remain in the same health state or die. These probabilities are based on the age and sex-dependent annual mortality rates, adjusted for previously reported death hazard rate ratios of stroke patients. The decision node is represented with a square. The circles represent chance nodes, the circles marked with an M represent Markov models and the triangles represent terminal nodes. EVT indicates endovascular treatment; IVT, treatment with intravenous thrombolytics; and LVO, large vessel occlusion.
