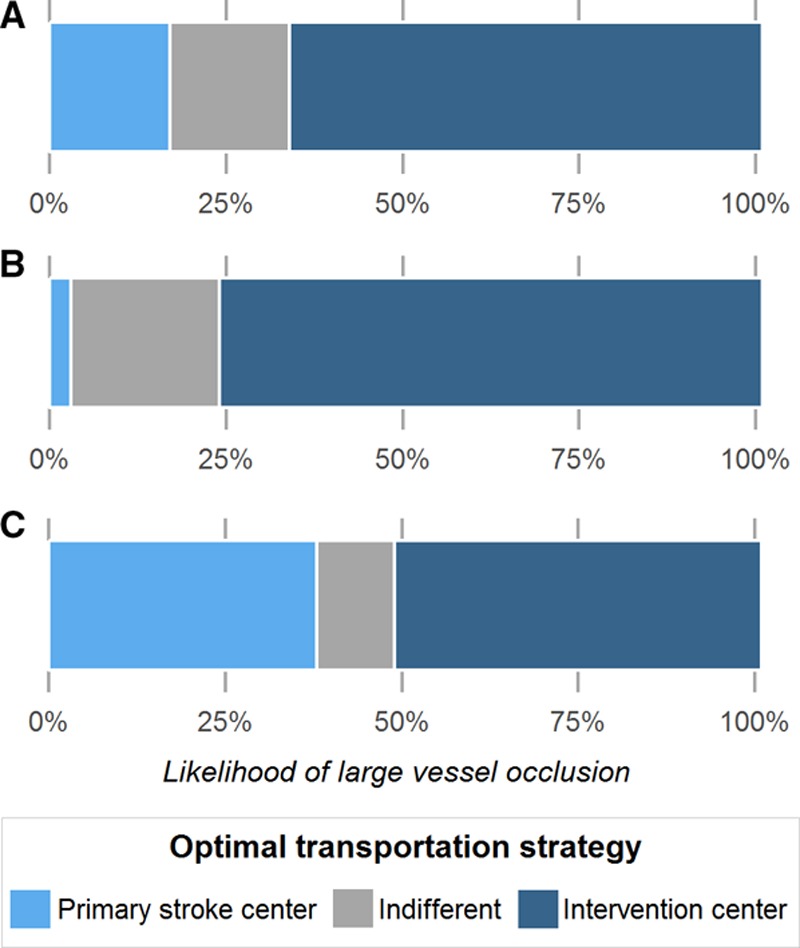
Figure 2.

The optimal transportation strategy based on the likelihood of large vessel occlusion. Primary stroke center: the nearest nonendovascular-capable stroke center; intervention center: the nearest endovascular-capable stroke center. A, Represents the base case scenario (primary stroke center at 20 min and intervention center at 45 min); (B) the urban scenario (10 and 20 min, respectively); and (C) the rural scenario (30 and 90 min).
