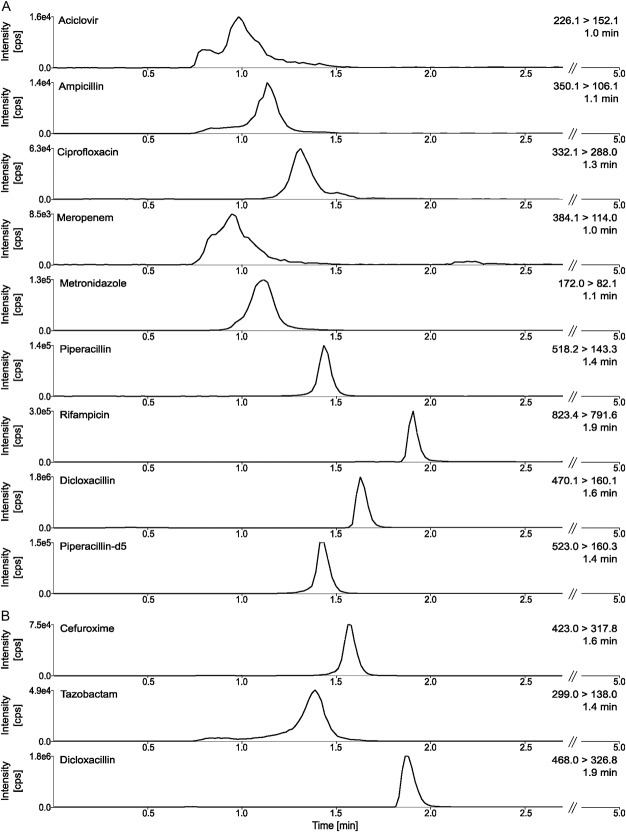
FIGURE 1.
Representative MRM chromatograms. The peaks are shown in an overall overview of positive and negative ionization, including retention times in a sample MRM chromatogram for 10 mg/L of antimicrobials in lithium–heparin plasma. A, MRM chromatogram of all antimicrobials (quantifier) with positive ionization, (B) MRM chromatogram of all antimicrobials (quantifier) with negative ionization.

