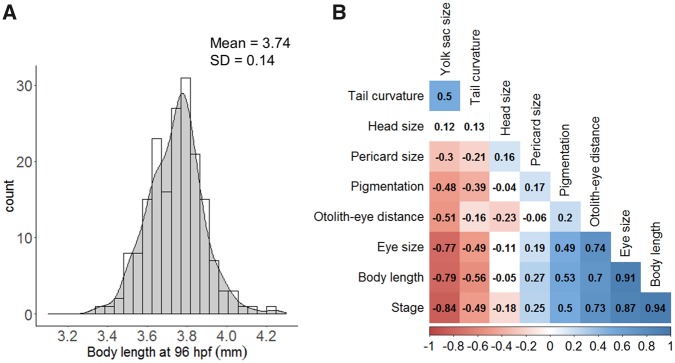
Figure 2.
Control variability and cross-correlation of morphological features. A, Example of distribution plot for total body length obtained for control population at 96 hpf (n = 183). The mean and standard deviation (SD) were used to derive a threshold to detect the fraction of treated embryos that deviate from controls (see Materials and Methods). B, Cross-correlation of the morphological features over zebrafish development (from 32 to 96 hpf). The plot displays Pearson’s linear correlation coefficient for every pair of variables. Correlation was based using the individual metric of each embryo (N = 44–79). Jaw-eye distance correlation was not included as it was only analyzed between 72 and 96 hpf (see Supplementary Figure 7).

