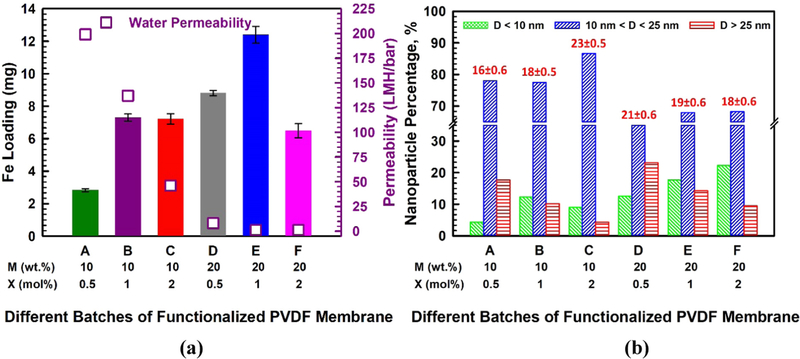
Fig. 6.
(a) Bar charts for the amount (mg) of Fe loading for different batches of functionalized membranes (membrane surface area = 13.2 cm2, membrane volume = 0.225 cm3), water permeability data during Fe2+ ion exchange are shown in right hand side y-axis, pH = 5.0–5.5, T = 22–24 °C, (b) particle size distribution and average particle size of different batches of functionalized membranes (total count is in the range of 300–400 NPs).

