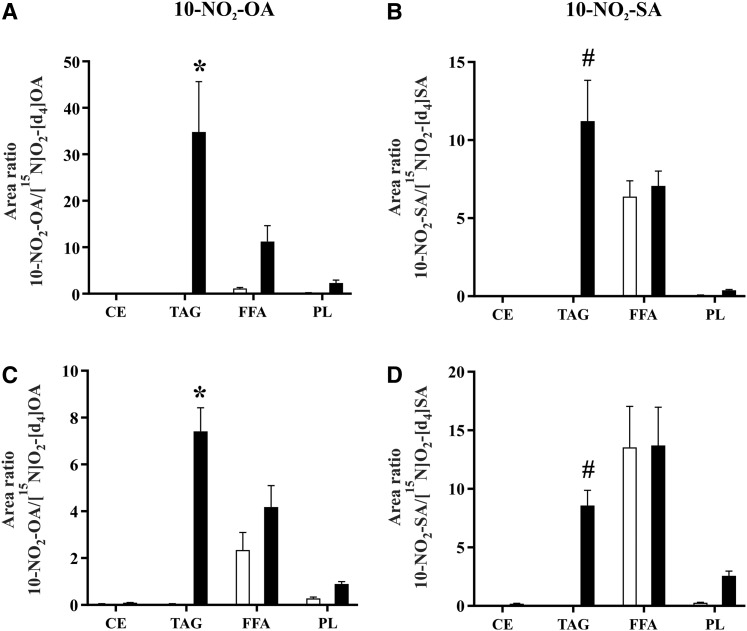
Fig. 8.
Biodistribution of 10-NO2-OA and 10-NO2-SA in plasma lipid fractions after oral supplementation of 10-NO2-OA. Free (white bars) and total (black bars) levels of 10-NO2-OA and 10-NO2-SA were analyzed at 1 h of day 1 (A, B) and day 14 (C, D). Data shown are the mean (n = 5) ± SE and two-way ANOVA plus Sidak’s multiple comparison were used for statistical significance (*P < 0.05 versus all the fractions; #P < 0.05 versus CE and PL).

