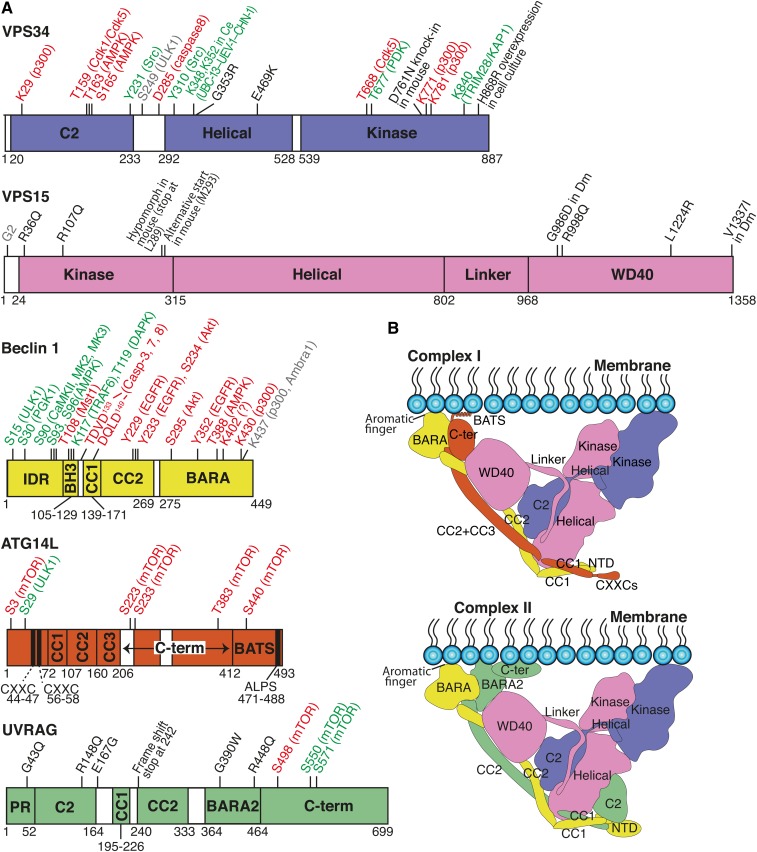
Fig. 1.
Structures of complex I and complex II. A: Schematic representations for the subunits of the class III PI3K complexes. Posttranslational modifcations (PTMs) and somatic mutations are indicated on the upper side of each subunit. Unless otherwise noted, all residue numbers are for the human sequences. Ce, C. elegans; Dm, D. melanogaster. Red, inhibiting; green, activating; gray, no effect or either inhibiting or activating; black, somatic mutations. B: Schematic structural models of complex I (top) and complex II (bottom). Because structural information on the CXXC, C-ter, and BATS regions of ATG14L, and the NTD and C-ter of UVRAG is not available, the boundaries of these domains are speculative.

