
Fig. 4. Comparison of thin sections with ground, immersed particles.
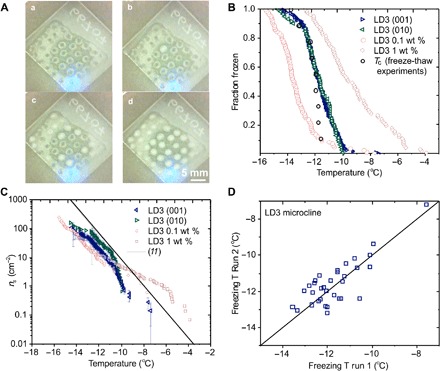
(A) (a to d) Images showing a freezing experiment for an array of water droplets on a feldspar thin section, where frozen droplets scatter more light. (B) Droplet fraction frozen as a function of temperature for LD3 microcline samples. Green and blue triangles represent thin sections prepared by cleaving along both the (010) and (001) faces, respectively. The clear red squares and circles represent the ground particles, immersed in the liquid droplets. (C) Active site density, ns(T), as a function of temperature for the data plotted in (B). In addition, plotted is a fit for BCS376 feldspar, made by Atkinson et al. (11) from data obtained in a similar microliter droplet experiment on a suspended powder of a typical alkali feldspar. (D) Correlation plot showing a comparison of nucleation temperatures between two freeze-thaw cycles for an array of water drops on an LD3 feldspar sample. The solid black line is the 1:1 line, along which the nucleation temperature would be the same for both cycles.