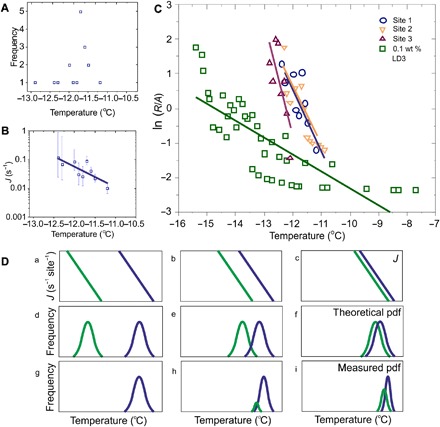
Fig. 5. Analysis of ice nucleation at active sites on feldspar.

(A) Nucleation temperatures observed for the most active site in a droplet (shown in fig. S4D), where the frequency is the number of nucleation events at that temperature. (B) The site-specific nucleation rate, J, plotted against temperature, calculated, assuming that each cycle in the freeze-thaw experiments represents an individual droplet in an array. (C) Plot showing the nucleation rates (normalized by the surface area) of water on three sites on thin sections compared with that of a 0.1 wt % suspension of feldspar powder. (D) (a to i) Schematics showing three different examples of droplets containing two sites with differing nucleation rates J. In (a), J in the most active region (blue) is much higher than in the less active region (green). If each active site were isolated, the two theoretical probability density functions (pdfs) in (d) would be expected. With both sites in the same droplet, the probability density function in (g) is expected, with all nucleation at the most active site. In (b) and (c), the difference in J decreases, so there is more overlap in the theoretical probability density function in (e) and (f), leading to the expected experimental observations in (h) and (i). When nucleation is observed at two different sites, the measured characteristic nucleation temperature at each site is biased toward a higher temperature, giving a narrower measured distribution than in the equivalent “theoretical” case. Consequently, site-specific nucleation rates can only be calculated for active sites dominating the nucleation (e.g., >88% of observations here).
