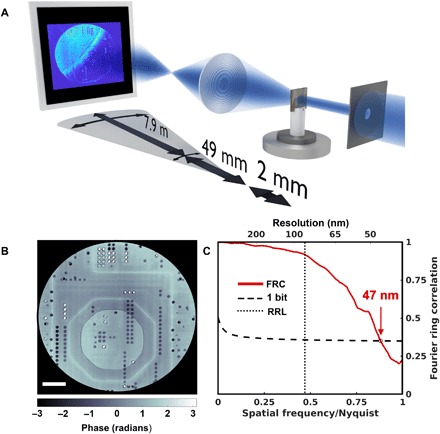
Fig. 2. X-ray Fourier ptychography by scanning the objective lens.

(A) A sketch of the experimental setup. Both objective lens and detector are scanned perpendicular to the optical axis. (B) The reconstructed phase image of an ASIC. Scale bar, 5 μm. (C) The resolution for a reconstruction using an FZP with an outermost zone width of 70 nm, a diameter of 100 μm, and a scan range of 80 μm was estimated using the Fourier ring correlation (FRC) between two independent scans to 47 nm, i.e., significantly below the Rayleigh resolution limit (RRL) of 85 nm for a conventional TXM, marked by the dotted line.
