
Fig. 3. Confirmation of quantitativeness.
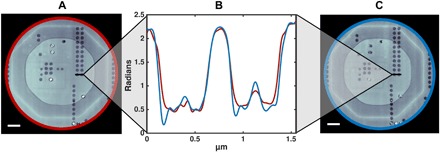
(A and C) A reconstruction of the same ASIC, measured with Fourier ptychography (A) and conventional ptychography (C) (16). Scale bar, 2 μm. Resolution estimate for (A) is 47 nm and that for (C) is 41 nm (16). (B) The phase of the x-ray Fourier ptychographic reconstruction was compared to its conventional ptychographic counterpart. (C) The line cuts of both reconstructed phases reveal that the phase profiles match and thus a quantitative reconstruction can be provided (red for the Fourier ptychographic reconstruction and blue for “conventional” ptychography).