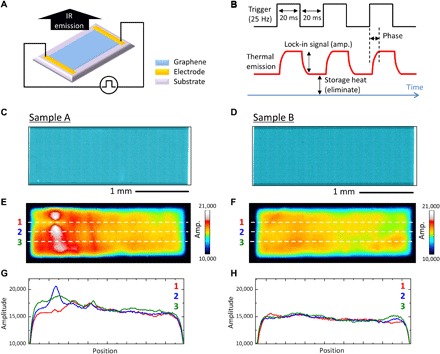
Fig. 1. LIT characterization of large-area graphene sheets.

(A) Schematic representation of measurement setup. (B) Operation principle of LIT. (C and D) Optical microscopy images of two polycrystalline graphene sheets. (E and F) Amplitude images of samples A and B, respectively. The measurement time was 10 min for both samples. Cross-sectional profiles of thermal amplitude along lines 1 to 3 in (E) and (F) are also shown in (G) and (H), respectively.
