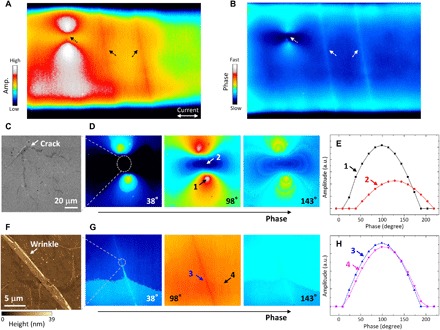
Fig. 2. High-magnification LIT image and detailed analysis of thermal properties.

(A) Amplitude and (B) phase images focused on a part of sample A. Characterization of thermal emission around (C to E) a crack and (F to H) wrinkle. The (C) crack and (F) wrinkle are optical microscopy and AFM images, respectively. Phase angle dependence of (D and G) amplitude images and (E and H) point intensities. a.u., arbitrary units.
