
Fig. 3. Correlation between thermal emission and electrical properties.
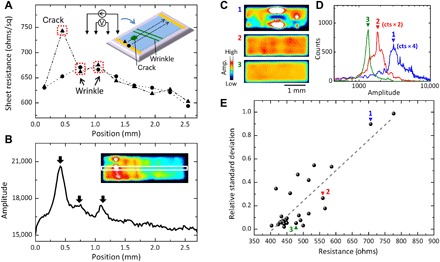
(A) Mapping result of local electrical resistance in sample A as measured by four-terminal probe method. The measurement setup and scanning area are schematically shown in the inset. The cross-sectional profile of the thermal amplitude is indicated in (B) for comparison. (C to E) Systematically investigated changes in thermal distribution properties versus resistance. The measurements were carried out under a constant current of 6 mA for all devices. All the LIT measurements were taken with a 10-min accumulation time. The dashed line in Fig. 3E is a guide to the eye.