
Fig. 4. Thermal visualization of DB defects.
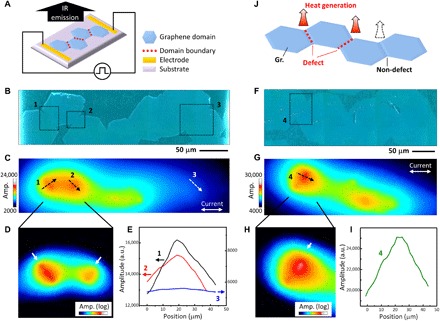
(A) Schematic diagram of measurement setup with multiple coalesced graphene domains and (B to E) experimental results. (B) Optical microscopy and (C) LIT images. (D) Expanded view on a logarithmic scale and (E) cross-sectional profile along the dashed arrows in Fig. 4C. (F to I) Results for another sample. All LIT images were obtained in 10 min. (J) Heat generation mechanism of DB.