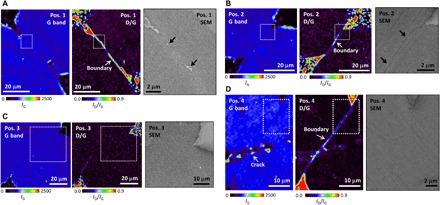
Fig. 5. Spectroscopic and morphological characterization of graphene DBs.

(A to D) Micro-Raman mapping and SEM images at positions 1 to 4 (Fig. 4, B and F). The locations in the SEM images correspond to the white dashed areas in the Raman images.

(A to D) Micro-Raman mapping and SEM images at positions 1 to 4 (Fig. 4, B and F). The locations in the SEM images correspond to the white dashed areas in the Raman images.