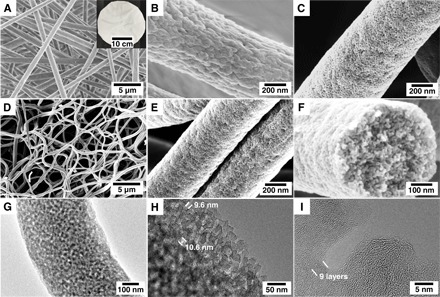
Fig. 2. Microstructures of PCFs.

SEM images of PAN-b-PMMA fibers (A and B) after electrospinning, (C) after oxidation and self-assembly at 280°C in air, and (D to F) after pyrolysis at 800°C in N2. Inset: A digital photograph of a piece of as-spun polymer fiber mat. (C) The bright and dark domains are PAN and PMMA, respectively. The good contrast between PAN and PMMA in the SEM image is due to the partial degradation of PMMA in air. (E and F) High-magnification SEM images of uniformly distributed mesopores in PAN-b-PMMA-CFs. (G and H) TEM images of mesopores in a PAN-b-PMMA-CF. (I) High-resolution TEM image of porous carbons at the edge of a PAN-b-PMMA-CF.
