
Fig. 2.
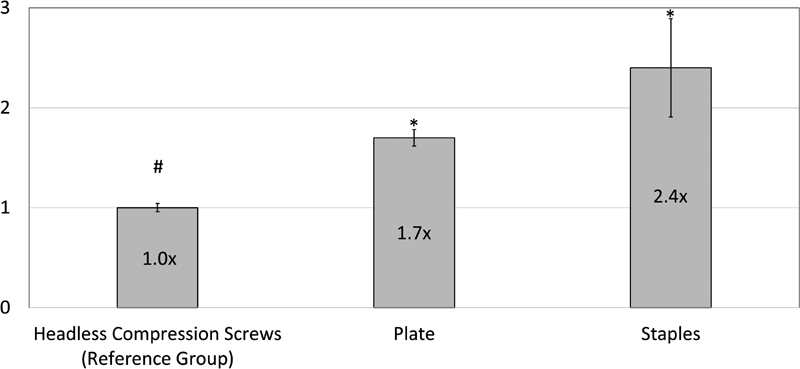
Data represent mean ± standard error of the mean (SEM). #Reference group, normalized to 1.0. * p < 0.05 as compared with left-sided neighboring value per Kruskal–Wallis tests and Tukey's multiple pairwise comparison tests. Values over graph bars represent fold-change differences relative to the reference group.