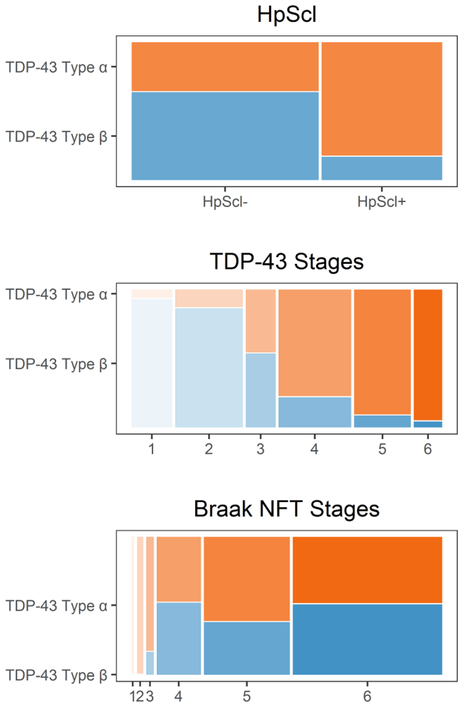
Figure 3:
Mosaic plots shows the percentages of hippocampal sclerosis (HpScl), TDP-43, and Braak NFT stages by TDP-43 type. These plots are graphical representations of two-way tables where the area of a “tile” is related to the number of individuals in the table cell. The figure demonstrates the striking association of TDP-43 type-α with HpScl and higher TDP-43 stage. For Braak NFT stages, there is no difference between TDP-43 type-α and type-β at Braak NFT stages IV-VI where > 90% of data exists. Orange color represents TDP-43 type-α; Blue color represents TDP-43 Type-β.

