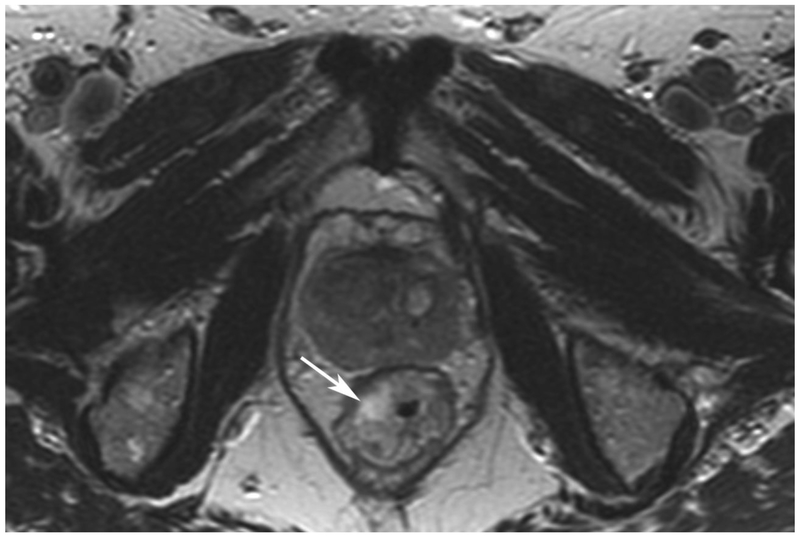
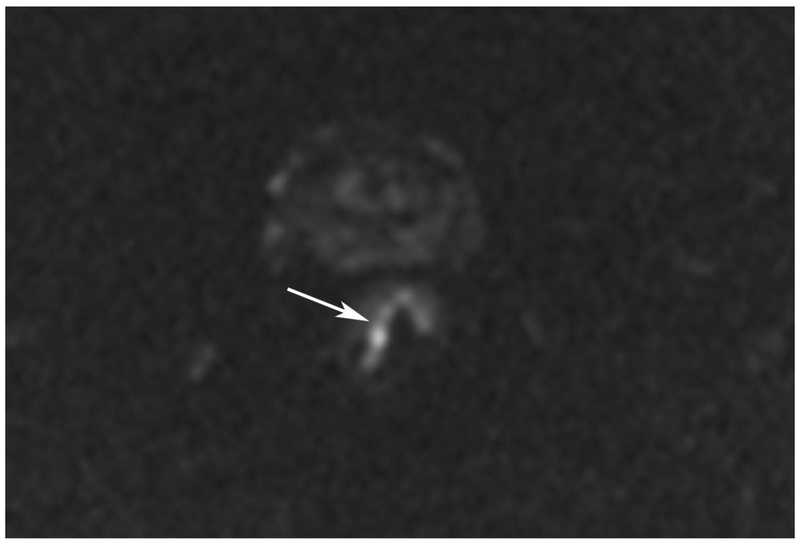
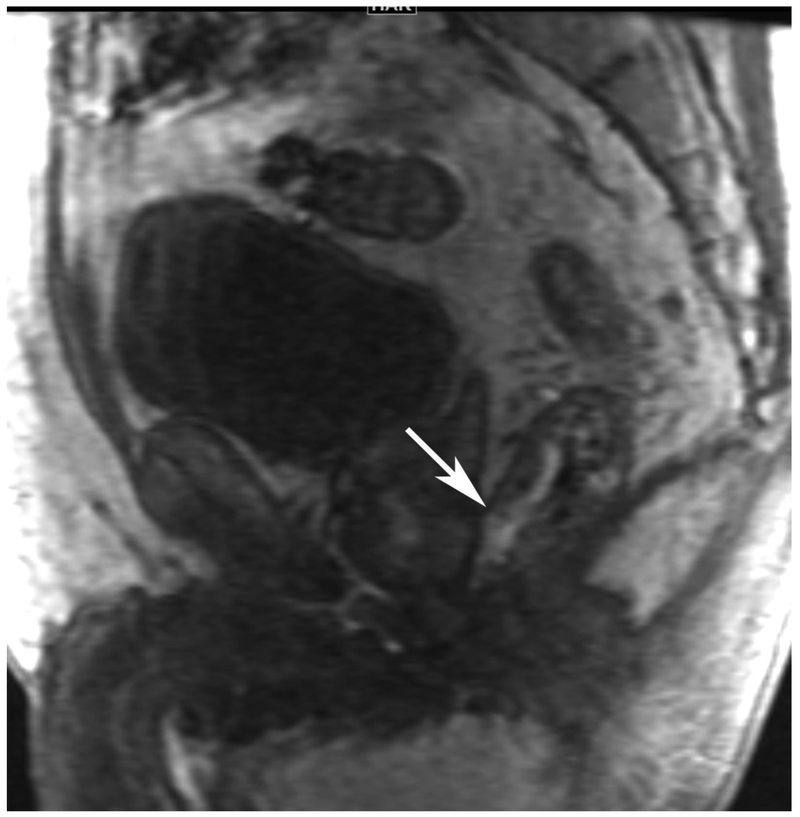
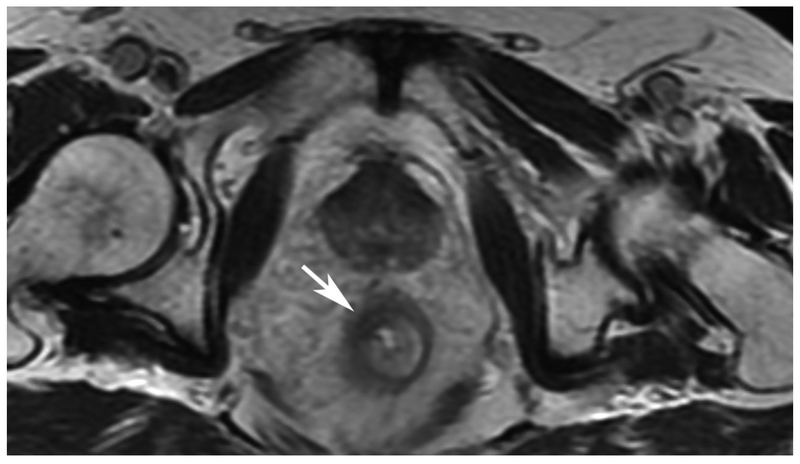
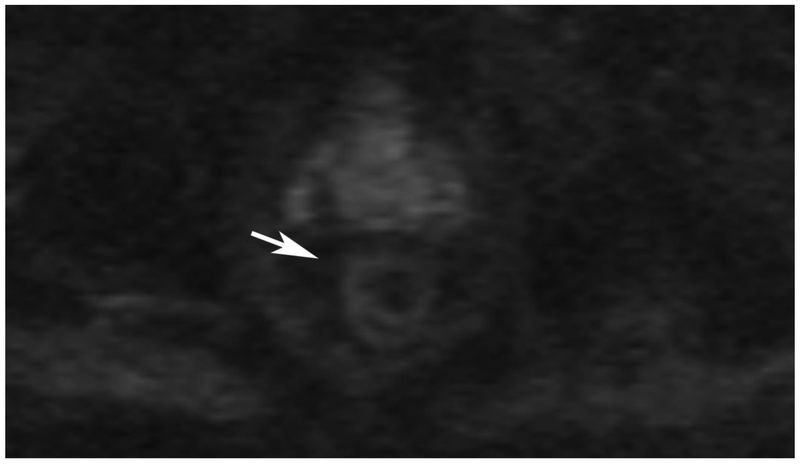
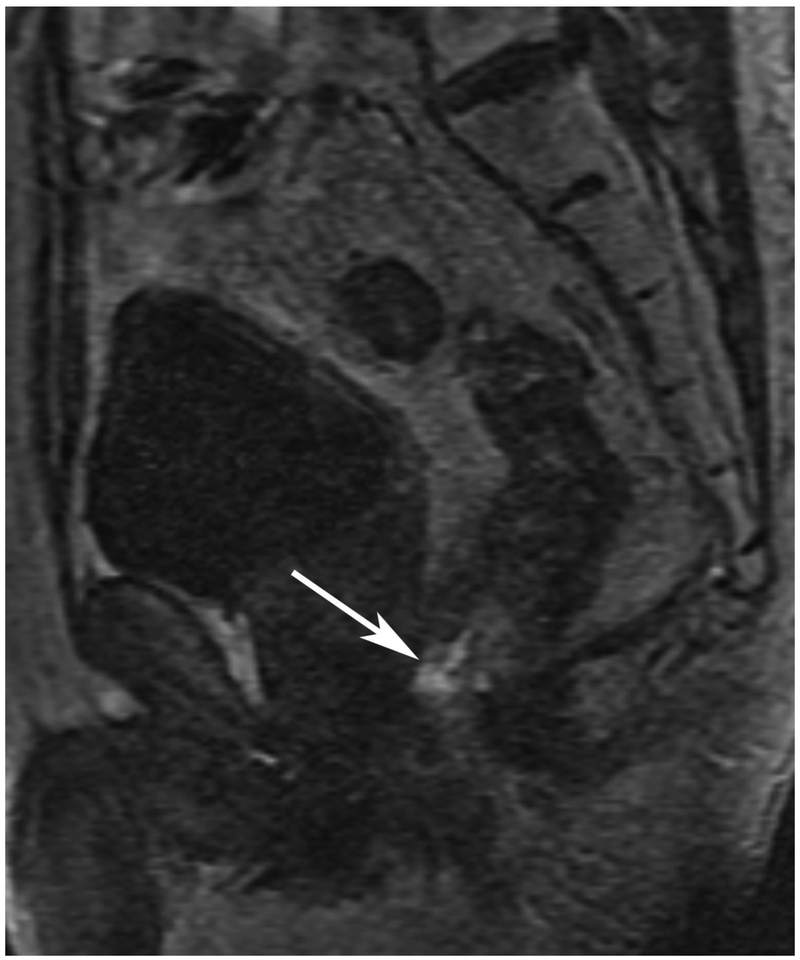
Figure 3.
67-year-old male with rectal cancer and pathological complete response after CRT with false positive DCE-MRI
A. Baseline axial T2-weighted image showing partly mucinous tumor (arrow)
B. Baseline axial DWI b800 showing tumor diffusion restriction (arrow)
C. Baseline sagittal dynamic contrast-enhanced image with tumor blush (arrow)
D. Post-CRT axial T2-weighted image shows scar in tumor bed (arrow)
E. Post-CRT axial DWI b800 shows absence of diffusion restriction in tumor bed (arrow)
F. Post-CRT sagittal dynamic contrast-enhanced image shows apparent residual tumor blush (arrow)

