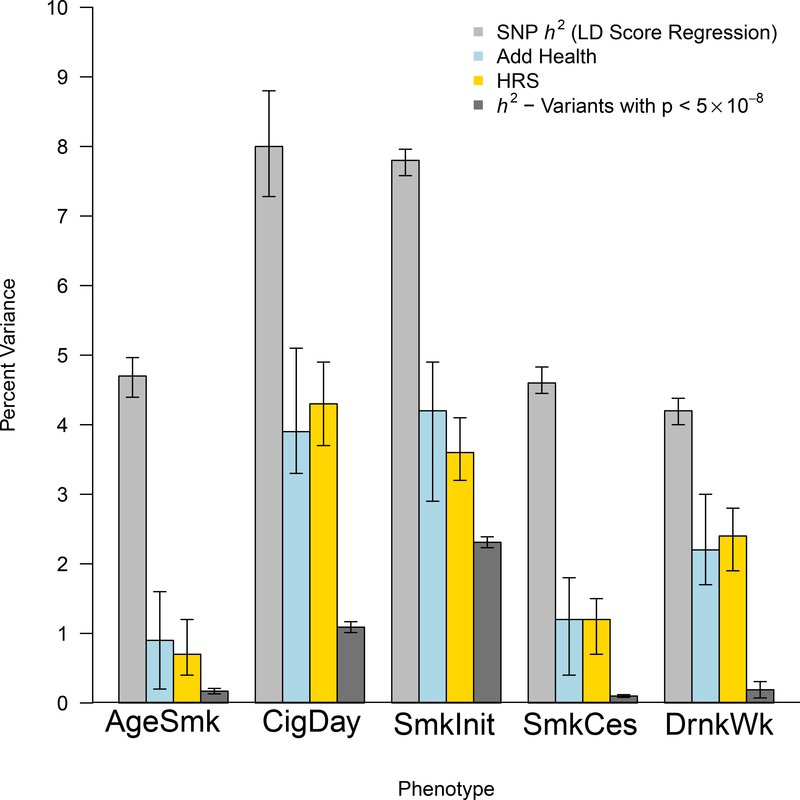
Figure 3. Heritability and polygenic prediction.
The light gray bars reflect SNP heritability, estimated with LD Score Regression. The light blue and gold bars reflect the predictive power of polygenic risk scores in Add Health and the Health and Retirement Study (HRS), respectively. Despite the 41-year generational gap between participants from these two studies, and major tobacco-related policy changes during that time, the polygenic scores are similarly predictive in both samples. Error bars are 95% confidence intervals estimated with 1000 bootstrapped repetitions. Dark gray bars represent the total phenotypic variance explained by only genome-wide significant SNPs. H2=heritability.

