Fig. 3.
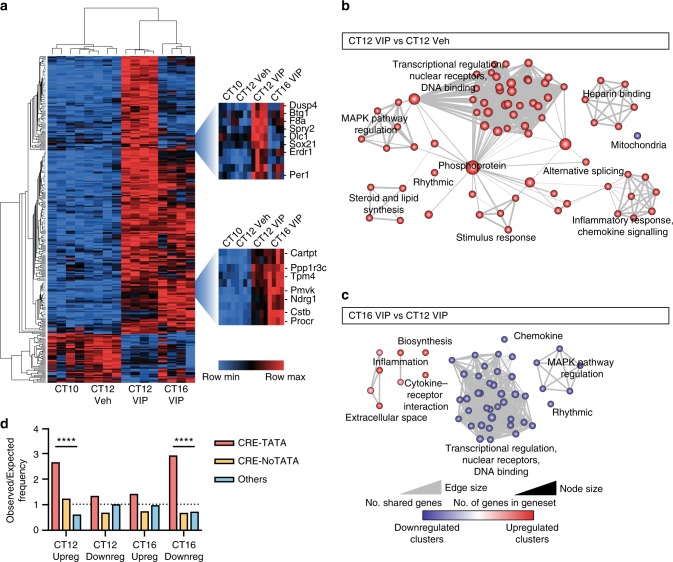
VIP-induced gene networks and cellular signalling pathways in SCN. a Hierarchically clustered heatmap of top 300 most significantly altered genes in CT12 VIP vs. CT12 Veh comparison across time and treatment using globally normalised probe expression levels. Two regions are enlarged: the top displays genes acutely upregulated 2 h after VIP treatment before returning to baseline levels, the bottom shows genes which continue to be upregulated after 6 h. Within each gene row, transcript levels have been normalised to the minimum (blue) and maximum (red) values for that given gene. b, c Functional annotation of genes significantly altered by VIP treatment after 2 h (b; 738 genes) and after 6 h (c; 342 genes) using DAVID functional annotation and visualised using the enrichment map plugin for Cytoscape. d Enrichment of CREs in the promoters of significantly regulated genes, displayed as observed/expected frequency, with expected values based on ratios of the appearance of promoter elements across all genes detected on the microarray at CT12 VIP vs. CT12 Veh. CRE-TATA: CRE within 300 bp of TATA box; CRE-NoTATA: CRE in promoter further upstream; Others: No CRE identifiable in promoter (promoter defined as 3 kb upstream to 300 bp downstream of the transcription start site). Chi-squared test, ****P < 0.0001

