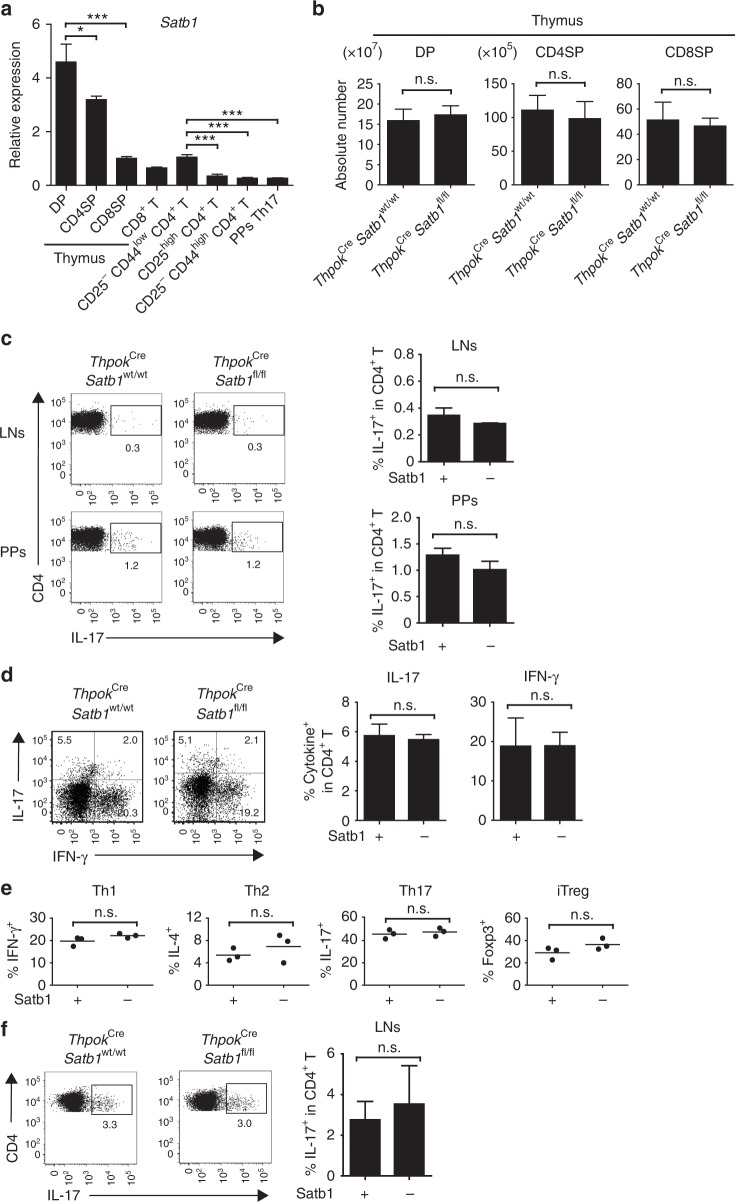
Fig. 1.
Normal development of non-pathogenic Th17 cells from Satb1-deficient T cells. a qPCR of CD4+ CD8+ (DP), CD4+ CD8− (CD4SP), and CD4−CD8+ (CD8SP) thymocytes and CD8+, CD25−CD44low CD4+, CD25high CD4+, CD25− CD44high CD4+, and PPs eYFP+ CD4+ T cells for Satb1 mRNA expression. b Numbers of DP, CD4SP, and CD8SP cells in the thymus of 4-week-old ThpokCre Satb1fl/fl and ThpokCre Satb1wt/wt littermate controls. c Flow cytometry of CD4+ T cells from the LNs and PPs of ThpokCre Satb1wt/wt and ThpokCre Satb1fl/fl mice for intracellular IL-17 expression. The frequencies of IL-17+ in CD4+ T cells are shown. d Flow cytometry of splenic CD4+ T cells for intracellular IL-17 and IFN-γ expression. The frequencies of IL-17+ and IFN-γ+ in CD4+ T cells are shown. CD25−CD44low CD4+ T cells (1 × 10⁶) from ThpokCre Satb1wt/wt and ThpokCre Satb1fl/fl mice were transferred to Rag2−/− mice, and splenic CD4+ TCRβ+ T cells were analyzed on day 7 after transfer. e The frequencies of IFN-γ+ Th1, IL-4+ Th2, IL-17+ Th17 and Foxp3+ iTreg cells. CD25−CD44low CD4+ T cells from ThpokCreSatb1wt/wt and ThpokCreSatb1fl/fl mice were cultured under Th1, Th2, Th17, and iTreg conditions for 3 days. Each symbol represents an individual mouse, and the horizontal lines indicate the mean values. f Flow cytometry of CD4+ T cells from the draining LNs of ThpokCre Satb1wt/wt and ThpokCre Satb1fl/fl mice immunized with MOG-CFA, staining for CD4 and intracellular IL-17 on day 7 after immunization. The frequencies of IL-17+ in CD4+ T cells are shown. The bar graphs (a–d, f) show the mean ± s.d. (n = 3). The results are representative of three independent experiments (a–f). *P < 0.05, ***P < 0.0001 (two-tailed unpaired Student’s t-test)

