Fig. 2.
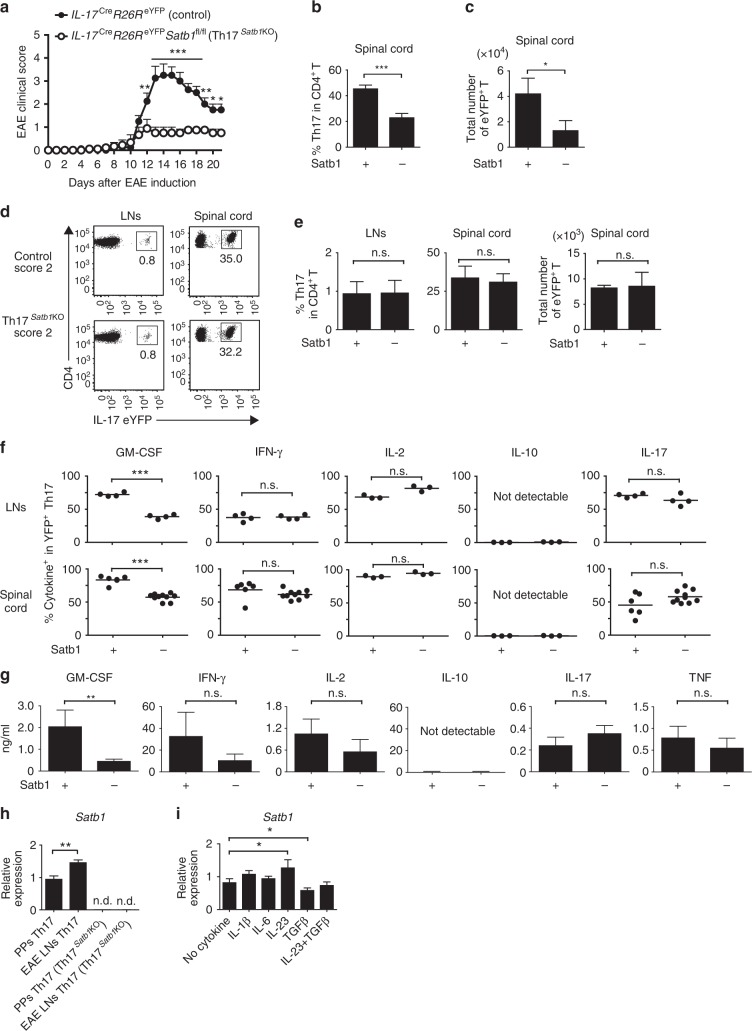
Regulation of pathogenic Th17 functions by Satb1. a The mean (+s.e.m.) clinical scores at the days after EAE was induced in Il17aCre R26ReYFP Satb1wt/wt (control) (n = 8) and Il17aCre R26ReYFP Satb1fl/fl (Th17Satb1KO) mice (n = 7). The incidence of EAE: control 8/8, Th17Satb1KO 6/7. *P < 0.05, **P < 0.001, ***P < 0.0001 (two-way ANOVA with Bonferroni’s post-test). b, c Percentages and absolute numbers of eYFP+ Th17 cells in the spinal cord of control and Th17Satb1KO mice with mean maximal scores of EAE at the peak of the disease (14 ± 3 days after EAE induction). d Flow cytometry of eYFP expression in CD4+ T cells from the draining LNs on day 10 and from the spinal cord of the mice showing the same EAE clinical score of 2 at the peak of the disease (on day 17 after EAE induction). e The frequencies and the total numbers of eYFP+ in CD4+ T cells as in (d) (n = 3). f The frequencies of GM-CSF+, IFN-γ+, IL-2+, IL-10+, and IL-17+ in eYFP+ CD4+ T cells as in (d). Each symbol represents an individual mouse. The horizontal bars indicate the means. g Cytokine concentrations in the culture supernatant of re-stimulated Th17 cells are shown. eYFP+ Th17 cells were sorted from the spinal cord of control or Th17Satb1KO mice at the peak of EAE. Sorted Th17 cells were re-stimulated with plate-coated anti-CD3 for 24 h. h qPCR of Satb1 mRNA expression in eYFP+ CD4+ T from PPs and draining LNs at day 7 after EAE induction. i qPCR of Satb1 mRNA expression in eYFP+ Th17 from the draining LNs of EAE mice on day 7 after re-stimulation with CD3/CD28 Dynabeads in the presence of the indicated cytokines for 24 h. The bar graphs (b, c, e, g–i) show the mean ± s.d. (n = 3). The results are representative of at least three independent experiments (a–i). *P < 0.05, **P < 0.001, ***P < 0.0001 (two-tailed unpaired Student’s t-test)

